


- Chainlink’s 3.9% price drop follows a 21.6% surge, reflecting short-term volatility amid a broader 2025 downtrend.
- Exchange reserves decline signals accumulation, though March’s 14.57M LINK inflow hinted at potential sell-off intentions.
Chainlink’s price has continued to decline over the last day, falling by 3.9% after previously rising approximately 21.6% between April 9 and April 21. Although the recent downturn suggests short-term volatility, Chainlink has experienced a prolonged downtrend throughout most of 2025.
Indicators from exchanges show that Chainlink reserves have steadily decreased since July 2024. Typically, a reduction in exchange-held tokens points to investor accumulation, as tokens are moved away from exchange platforms to private wallets or cold storage.
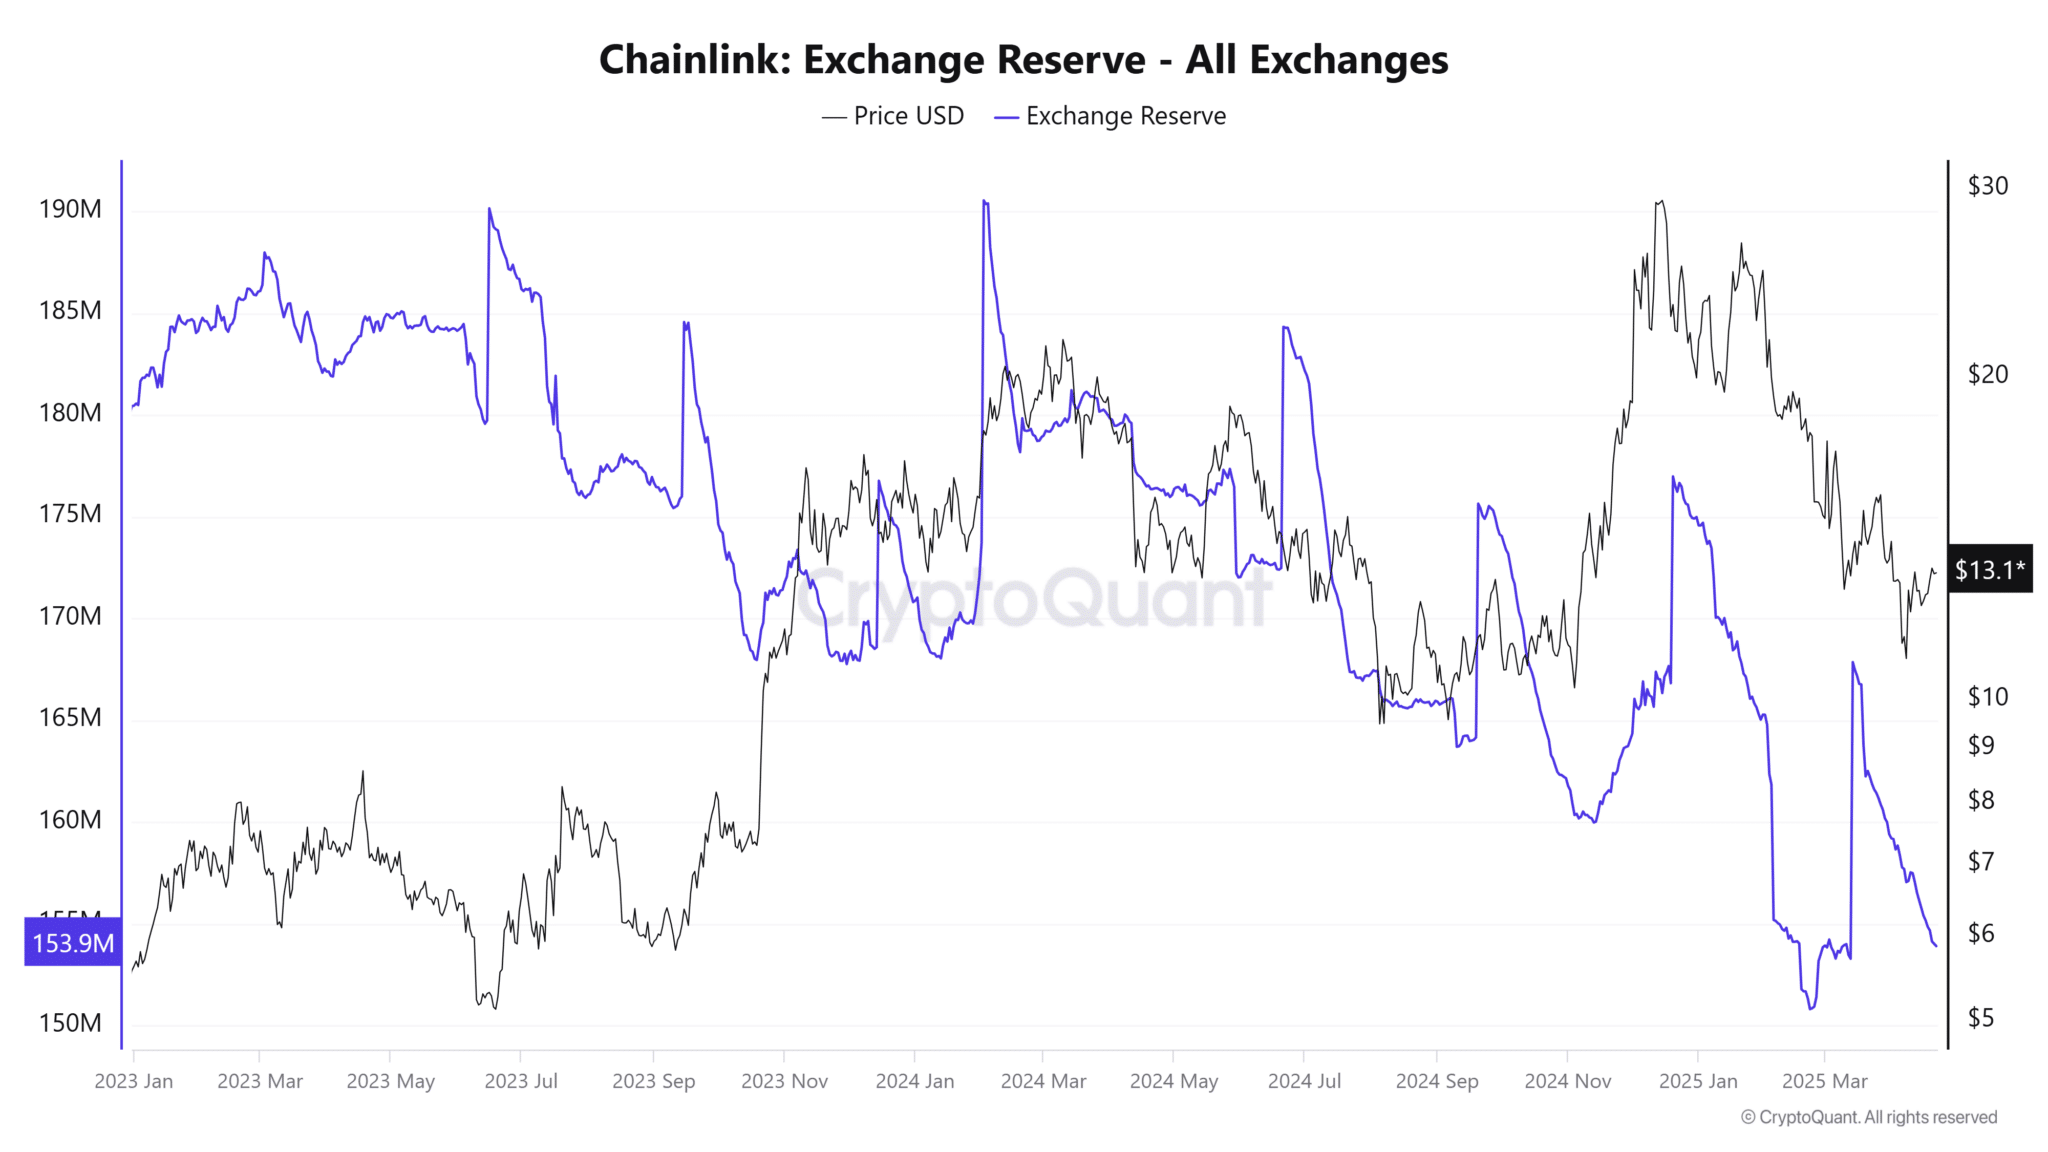
The logic behind this is straightforward: when tokens flow back onto exchanges, it’s often interpreted as preparation for selling, placing downward pressure on price.
This pattern was temporarily disrupted on March 14, when there was a sudden surge in Chainlink inflow to exchanges, totaling 14.57 million LINK tokens. Such large-scale transfers generally imply intentions either to sell or use tokens as collateral in derivative markets. Despite this, the reserves again showed consistent withdrawals, ultimately reaching levels last seen in June 2022.
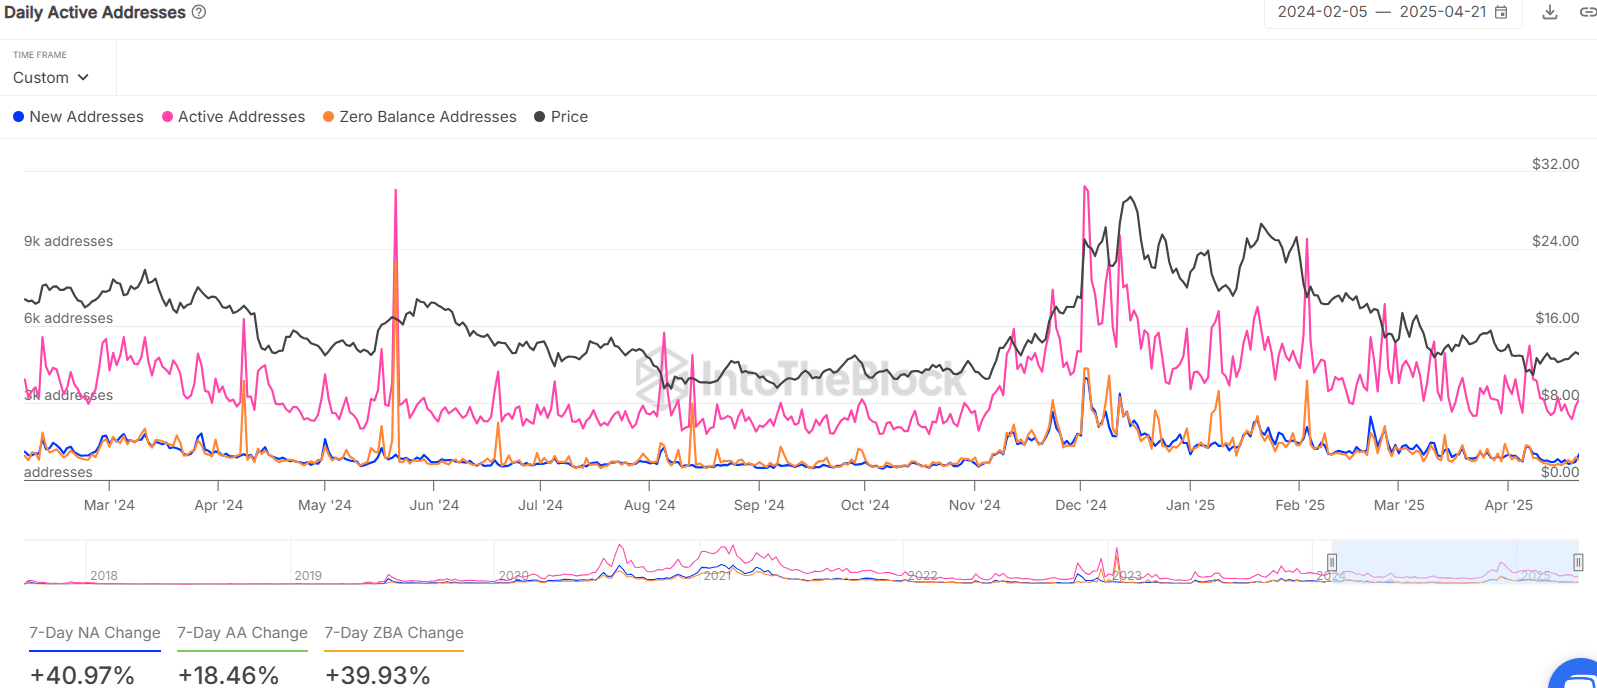
In parallel, activity data from IntoTheBlock highlighted that new Chainlink addresses rose by nearly 41% over the past seven days. Active addresses also increased by roughly 18%, alongside a modest price increase of nearly 7%. These figures suggest increased Chainlink usage and rising token demand. Nevertheless, this network activity remains considerably below the peaks reached during late 2024.
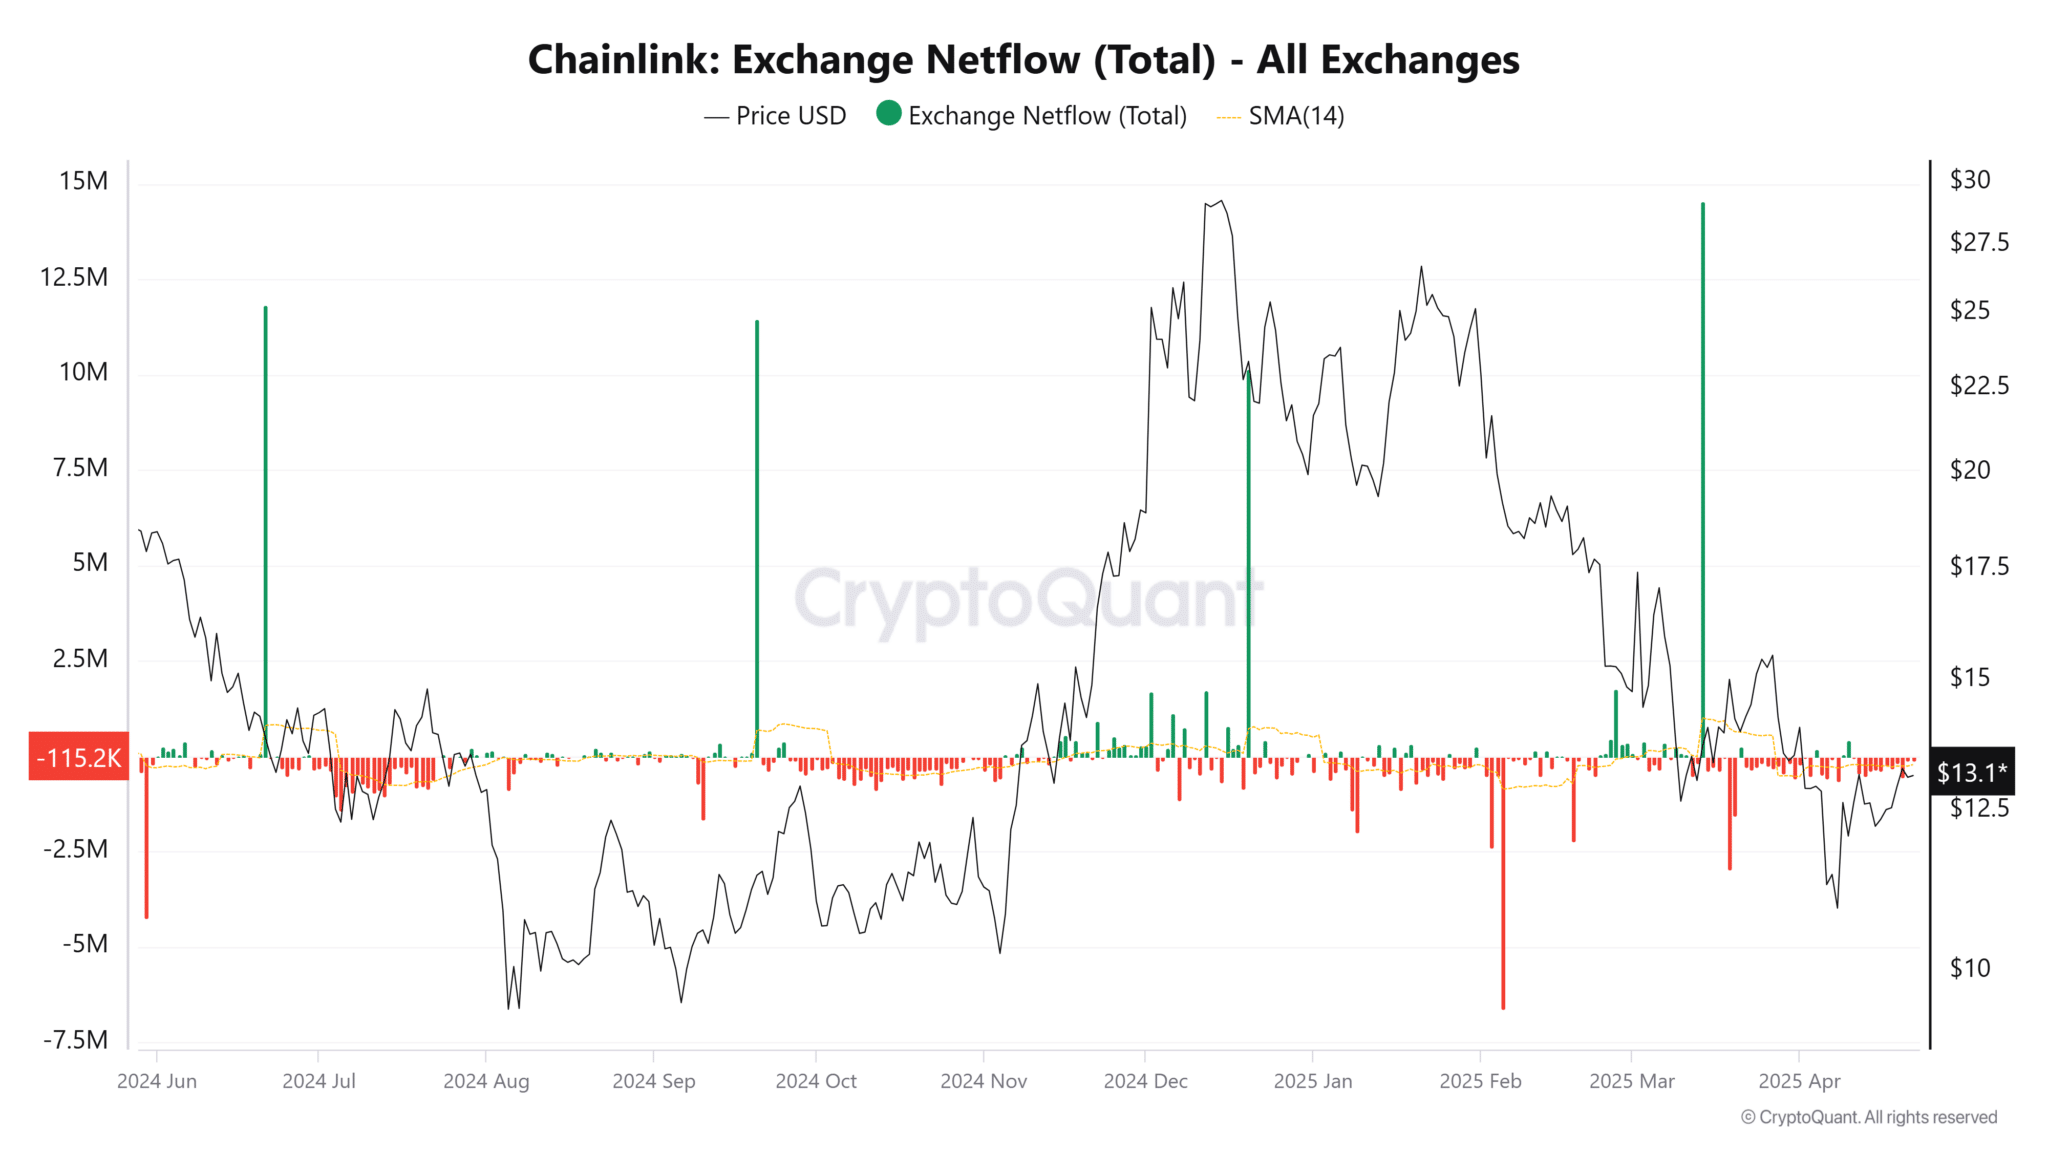
Another critical detail in Chainlink’s token distribution is that whales currently control about 46.1% of the total supply. Whale movements often significantly affect market stability, especially given the occasional high-volume inflows to exchanges over the past ten months. While recent outflows may hint at positive investor sentiment, the presence of substantial inflows on other occasions means caution is warranted.
For Chainlink investors, the implications of these mixed signals are clear. Short-term rises in network engagement and withdrawals from exchanges could be positive, but the broader downward trend and the substantial influence of large investors suggest a cautious approach.
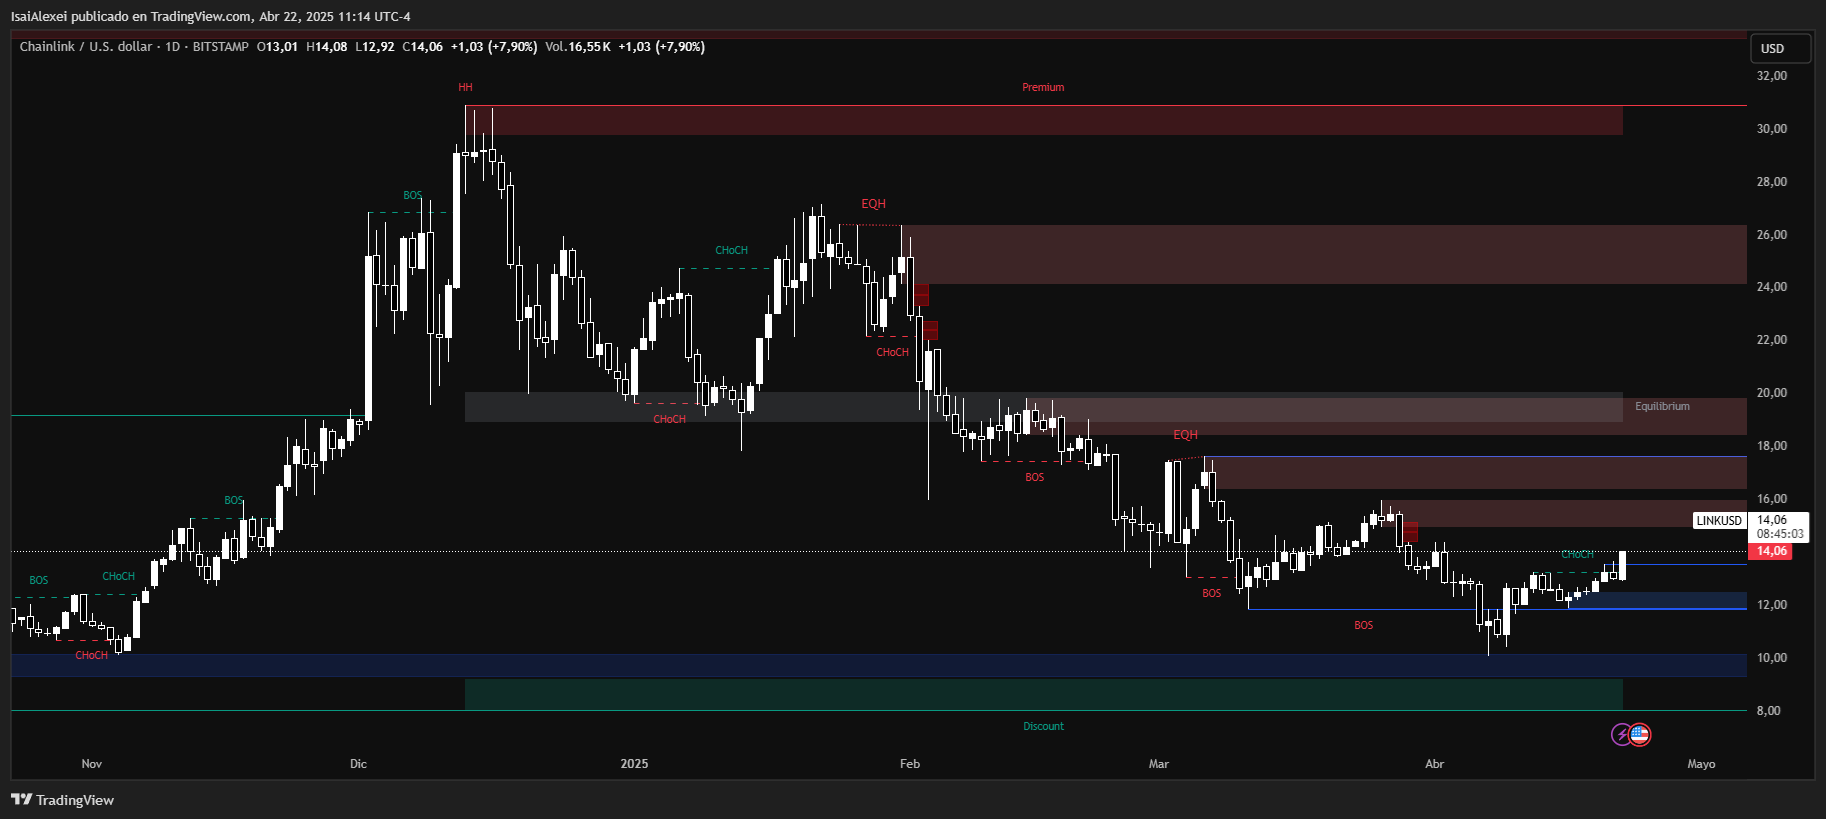
Chainlink (LINK) is currently trading at $14.08, showing a strong +8.70% daily gain, and marking a 10.55% increase over the past week. This recent upward momentum signals a recovery attempt after an extended bearish period.
Despite the rebound, LINK remains down 30.05% year-to-date and 1.84% lower over the past month, indicating that the broader trend still leans bearish. From its all-time high of $52.99, LINK is trading roughly 74% below peak levels, but investor interest is returning, as reflected in its $341 million daily trading volume.
From a technical standpoint, LINK is approaching a key resistance zone around $14.45, which has historically acted as a rejection point. A confirmed breakout above that level would be bullish and could open the path toward $16.00–$17.50.
Conversely, failure to sustain above $13.00 may trigger a short-term pullback to $11.60, where a strong support base lies. Momentum indicators like RSI are trending upward but have not yet reached overbought territory, signaling room for continuation if volume holds.