- Fantom’s price surge is buoyed by a rounded bottom pattern on its chart, suggesting a potential shift towards a bullish trend.
- The current sentiment in the market towards Fantom is positive, with a Fear and Greed Index at 74, indicating greed.
The Fantom (FTM) token has managed to stand out positively. This scenario unfolds while Bitcoin has seen a decrease, falling below the $65,000 level. Unlike Bitcoin, Fantom has seen an upward move of more than 13%, thus crossing the $1 mark.
This trend in the market became particularly noticeable from the end of January, as Fantom’s price began to rise from a support level of $0.3, also aligning with the 200-day exponential moving average. These factors contributed to a 241% rise in its value over two months, establishing its price at $1.04.
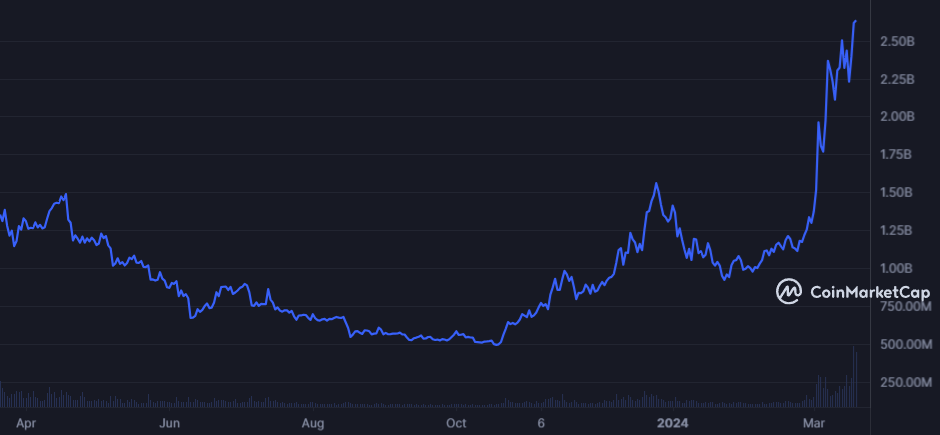
The rise in FTM’s price was also matched by an increase in open investment positions, moving from $63.5 million to $267 million, according to data from Coinglass. This represents a 320.47% increase and indicates a growing investor confidence in Fantom. This period was also marked by the formation of a rounded bottom pattern on the FTM price chart, which could be seen as an indication of a shift towards a bullish trend.

Currently, Fantom trades at $0.9489, with a trading volume of $3.34 billion over the last 24 hours. Fantom’s market capitalization stands at $2.82 billion, holding a market share of 0.12%. In terms of price change, FTM has seen an 18.66% increase in the last day.

Fantom reached its peak value on 28 October 2021, hitting $3.47, while its lowest value was recorded on 13 March 2020, dropping to $0.001762. From its peak, the lowest price was $0.164761, and the highest since then has been $1.079680. The market’s current view on Fantom is predominantly positive, with a Fear and Greed Index sitting at 74, indicating a greed-driven atmosphere.

The current circulating supply of Fantom is 2.80 billion FTM, with a maximum supply of 3.18 billion FTM. The annual inflation rate of the supply is 0.92%, resulting in the creation of 25.44 million FTM over the last year.

The growing interest in Fantom is also evident from the increase in daily trading volume and the retention of investments by 40% of investors, who anticipate benefiting from a rise in the token’s value. Additionally, the recent decrease in FTM token supply this month has contributed to a price increase, indicating a rising interest from investors with capital.
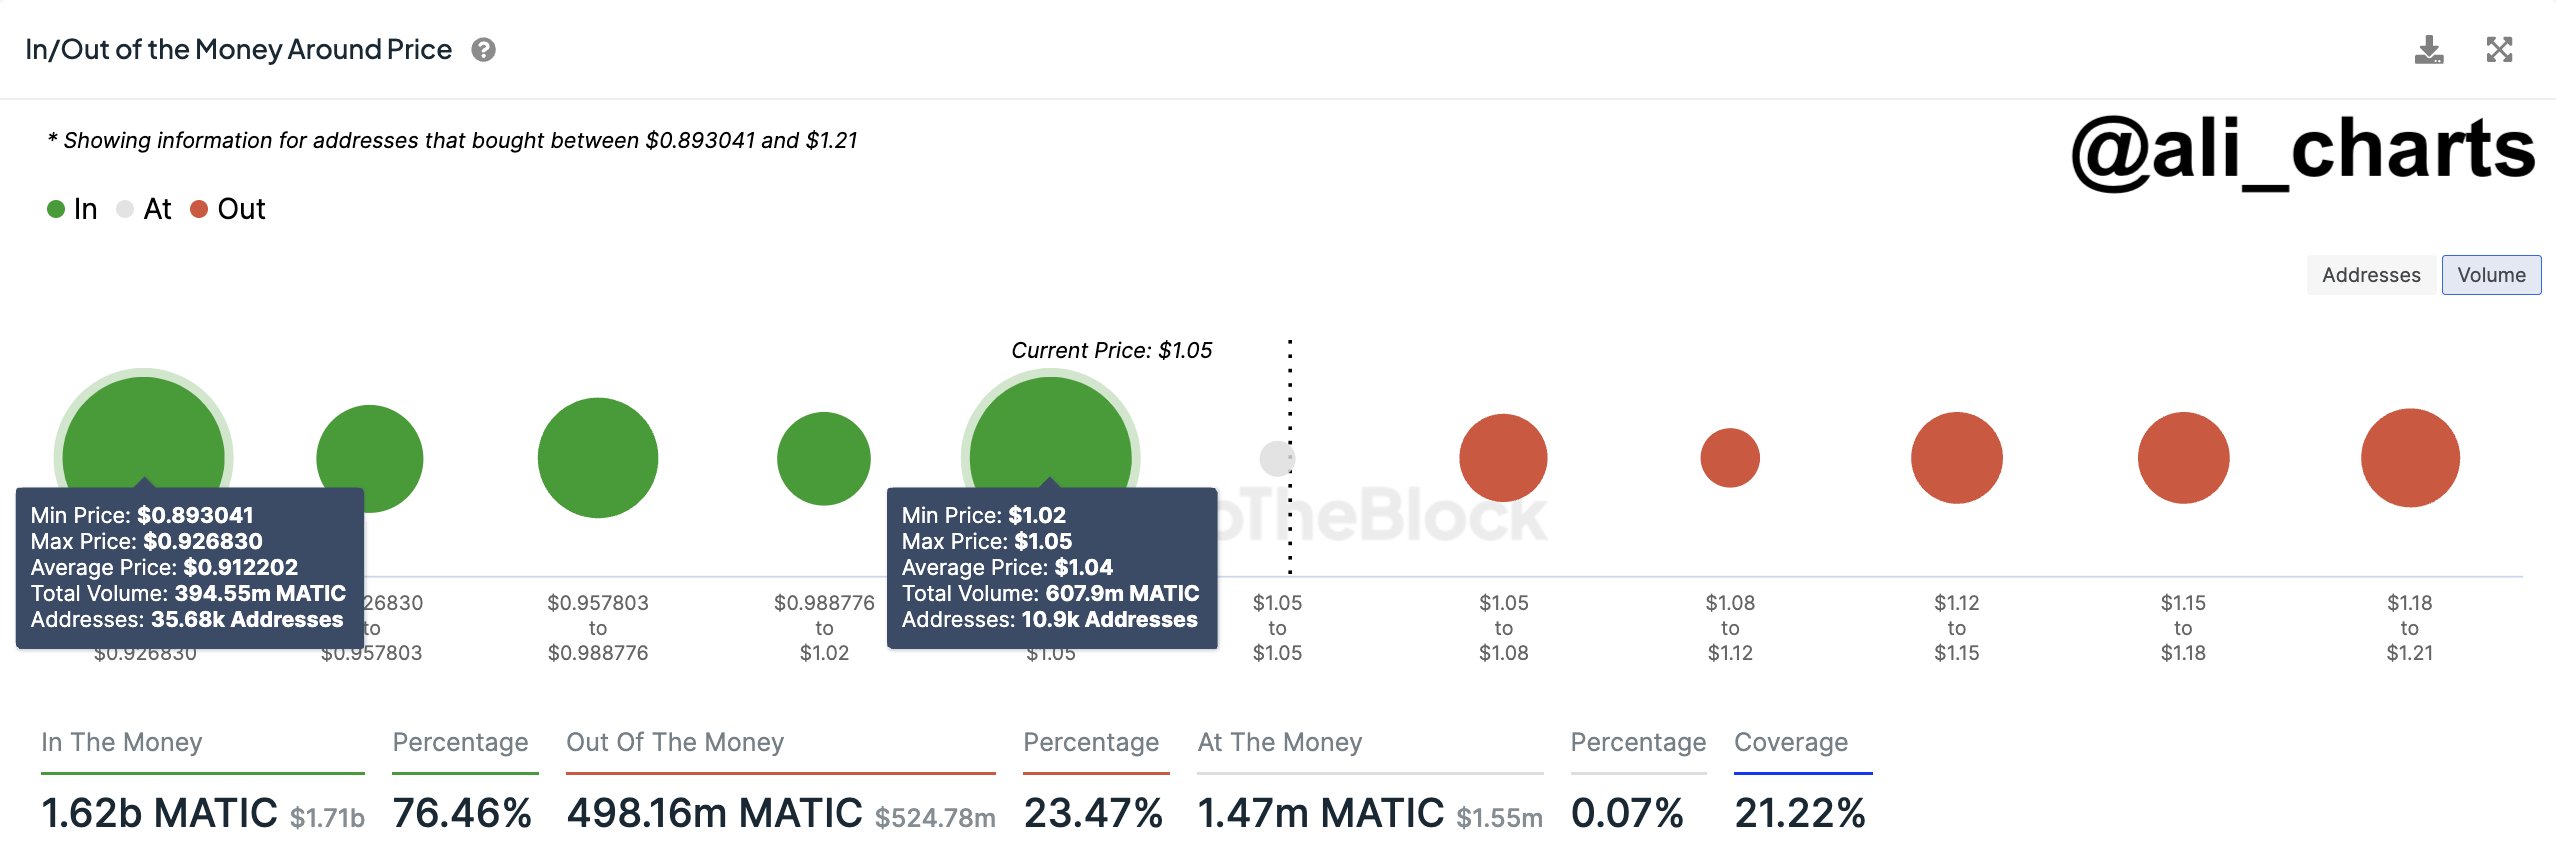
Observing the performance of other cryptocurrencies, like Cardano (ADA) and Polygon (MATIC), which offer different perspectives in the broad spectrum of crypto assets.
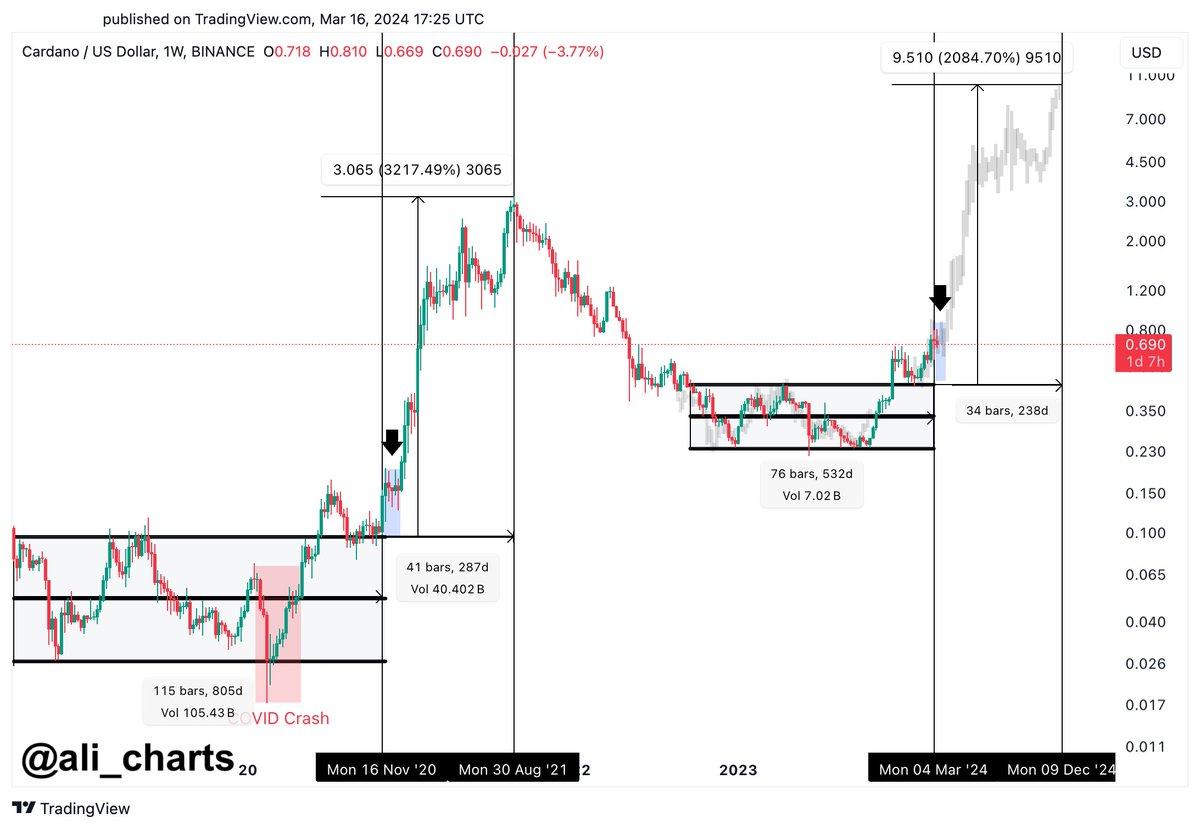
Cardano (ADA) offers an interesting parallel, especially when looking at its performance between 2018 and 2021. During this time, ADA experienced a long consolidation, fluctuating between $0.025 and $0.1, before breaking this trend at the end of 2020, ultimately reaching a record high of $3.10.
So far, #Cardano resembles the pattern observed from 2018 to 2021.
Should this fractal continue, anticipate $ADA to consolidate in the $0.55 to $0.80 range in the coming weeks, followed by a surge to $1.70. After this upswing, expect a period of further consolidation, setting… pic.twitter.com/46LIp2hkMx
— Ali (@ali_charts) March 16, 2024
According to these views, Cardano might continue its consolidation in the current range of $0.55 to $0.8 before experiencing a new breakout. This potential upward movement could lift ADA’s price to $1.7, followed by another consolidation phase possibly preceding an even more substantial rise, potentially reaching $5 before the end of 2024.
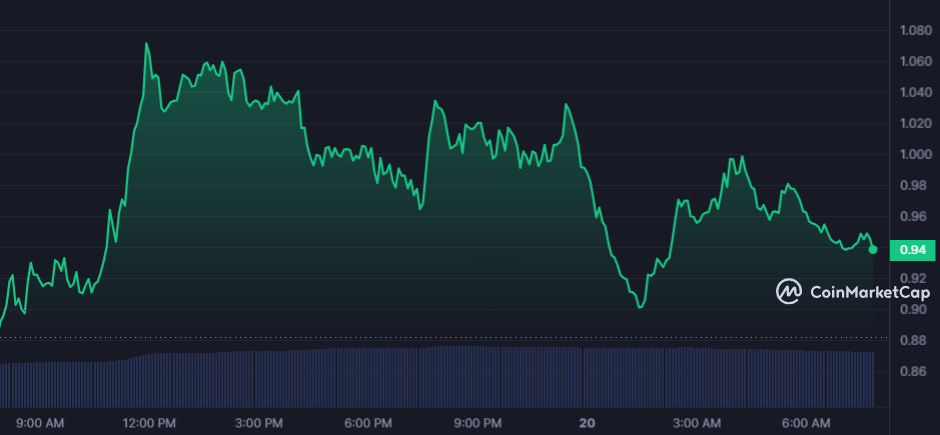
Since mid-February, the TD Sequential indicator has nailed it with $MATIC price predictions on the 4-hour chart! Now, it's flashing a buy signal, potentially setting #MATIC up for a rebound off the $0.92 support level. pic.twitter.com/7Md6Iwlrtd
— Ali (@ali_charts) March 19, 2024
Recent trading activity in MATIC illustrates this volatility, with a series of movements including declines and recoveries. These fluctuations, marked by price changes, provide potential buying and selling points according to technical analysis.
MATIC has demonstrated resistance at the support level of $0.92, indicating a critical moment that could precede a significant recovery if the anticipated buy signal materializes.


