


- MATIC’s recent shift to bearish momentum is contrasted by its exit from a bullish pattern, suggesting possible future uplift.
- The significant resistance level at $1.11 could play a crucial role in MATIC’s immediate price trajectory.
The cryptocurrency market, with Polygon (MATIC) in focus, has recently seen some notable fluctuations. Following a week of positive growth, the digital asset’s daily chart demonstrated a shift towards bearish sentiment.
Nonetheless, experts suggest holding off on immediate concerns due to MATIC emerging from a bullish configuration, which might indicate an upcoming positive trend.
Polygon’s Recent Performance: A Shift to Bearish Dynamics
During the previous week, Polygon experienced a noteworthy increase of over 4% in its value, a development that was well-received by investors. However, the momentum appeared to reverse in the last 24 hours, with the asset experiencing a 2% dip in its price, as per the data from CoinMarketCap.
At the moment, MATIC is valued at $0.9905, supported by a substantial market capitalization of just over $9.4 billion, highlighting its considerable role in the cryptocurrency sphere.
[mcrypto id=”12341″]World of Charts, a recognized entity on X (formerly Twitter), pointed out that MATIC is transitioning away from a bullish triangle pattern. This technical development is often seen as an indicator of potential future gains, leading to speculative discussions among the trading community regarding the short-term direction of the token.
Finally Breakout & Retest Has Confirmed As Exoected Massive Volume Coming In Expecting Massive Bullish Wave Can Start Anytime Now As The Trend Is Up In #Crypto Its Easy To Find Entries With In Direction Of Trend https://t.co/m47r0ajzHi pic.twitter.com/SSg5lrCquC
— World Of Charts (@WorldOfCharts1) February 24, 2024
Market Sentiment Analysis: Interpreting Mixed Signals
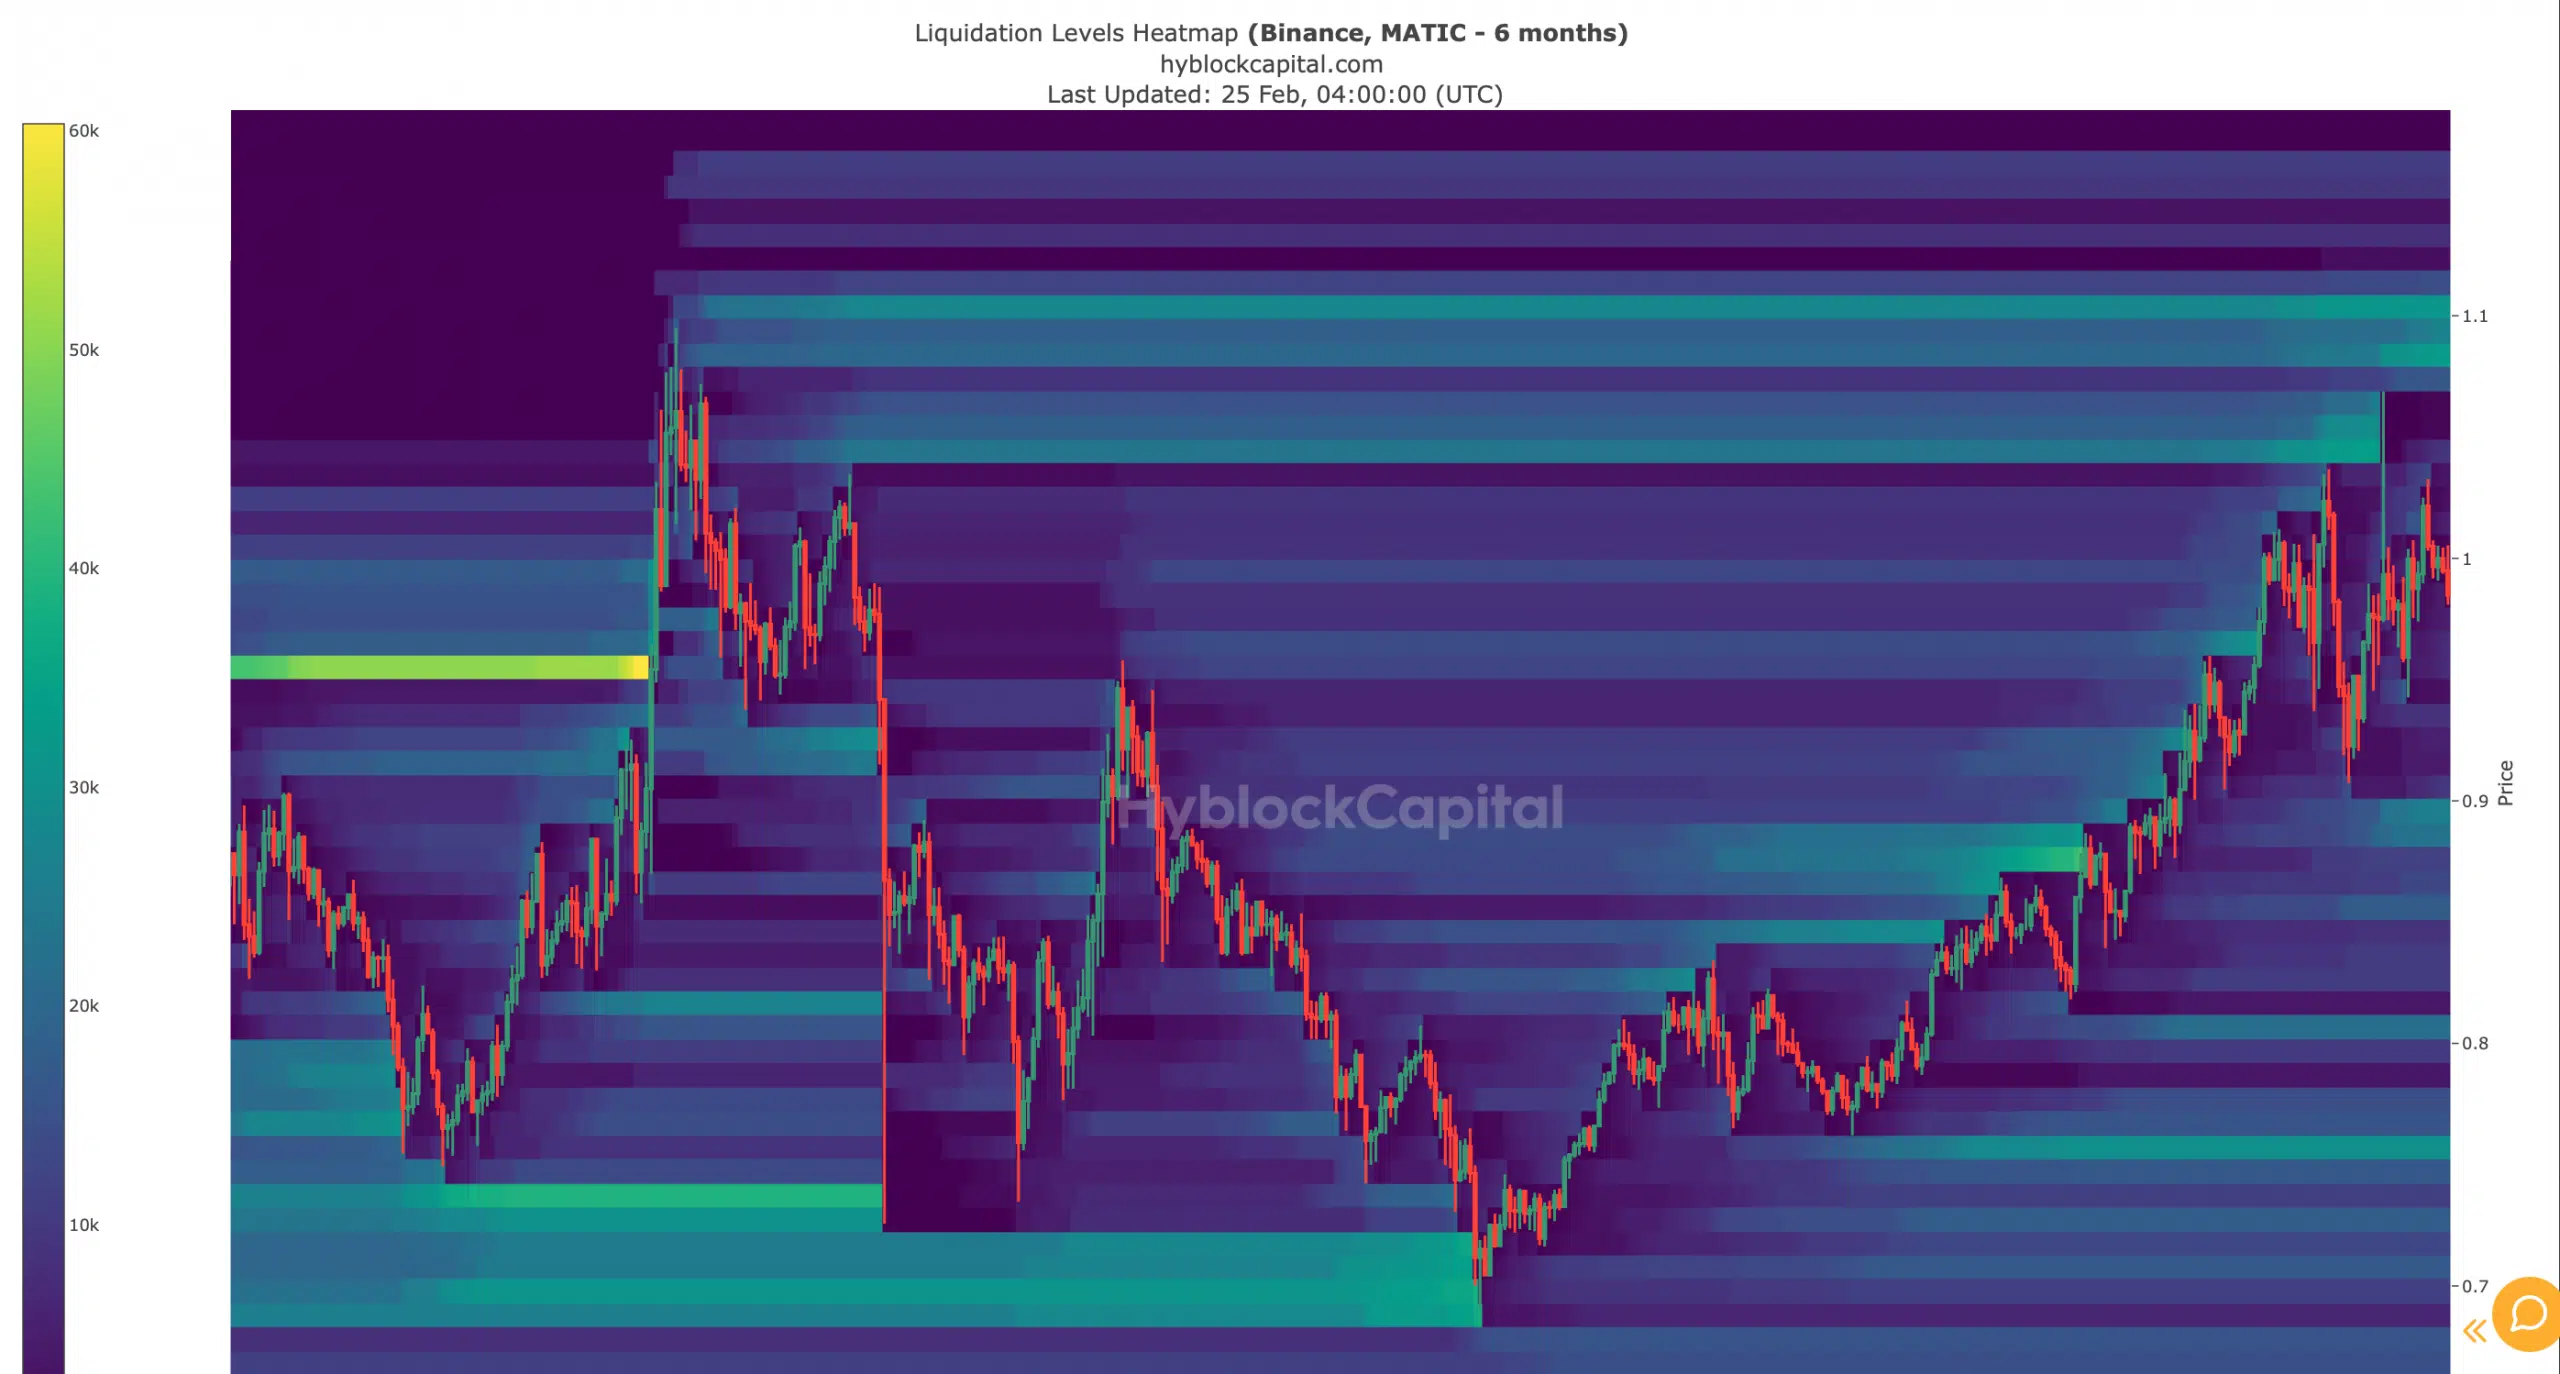
In-depth examination into MATIC’s liquidation heatmap revealed certain resistance areas that might impact its future price movement. The $1.11 price point emerged as a significant resistance level, where an uptick in liquidation could lead to increased selling pressure, potentially affecting the token’s valuation negatively.
A noteworthy finding was the reduction in MATIC’s exchange reserve, usually a sign of bullish momentum indicating diminished selling pressure. Nonetheless, other indicators presented a more nuanced view.
For instance, there was a decline in the MVRV ratio, and the level of MATIC held by major addresses did not show significant accumulation, suggesting a lack of commitment from large investors.
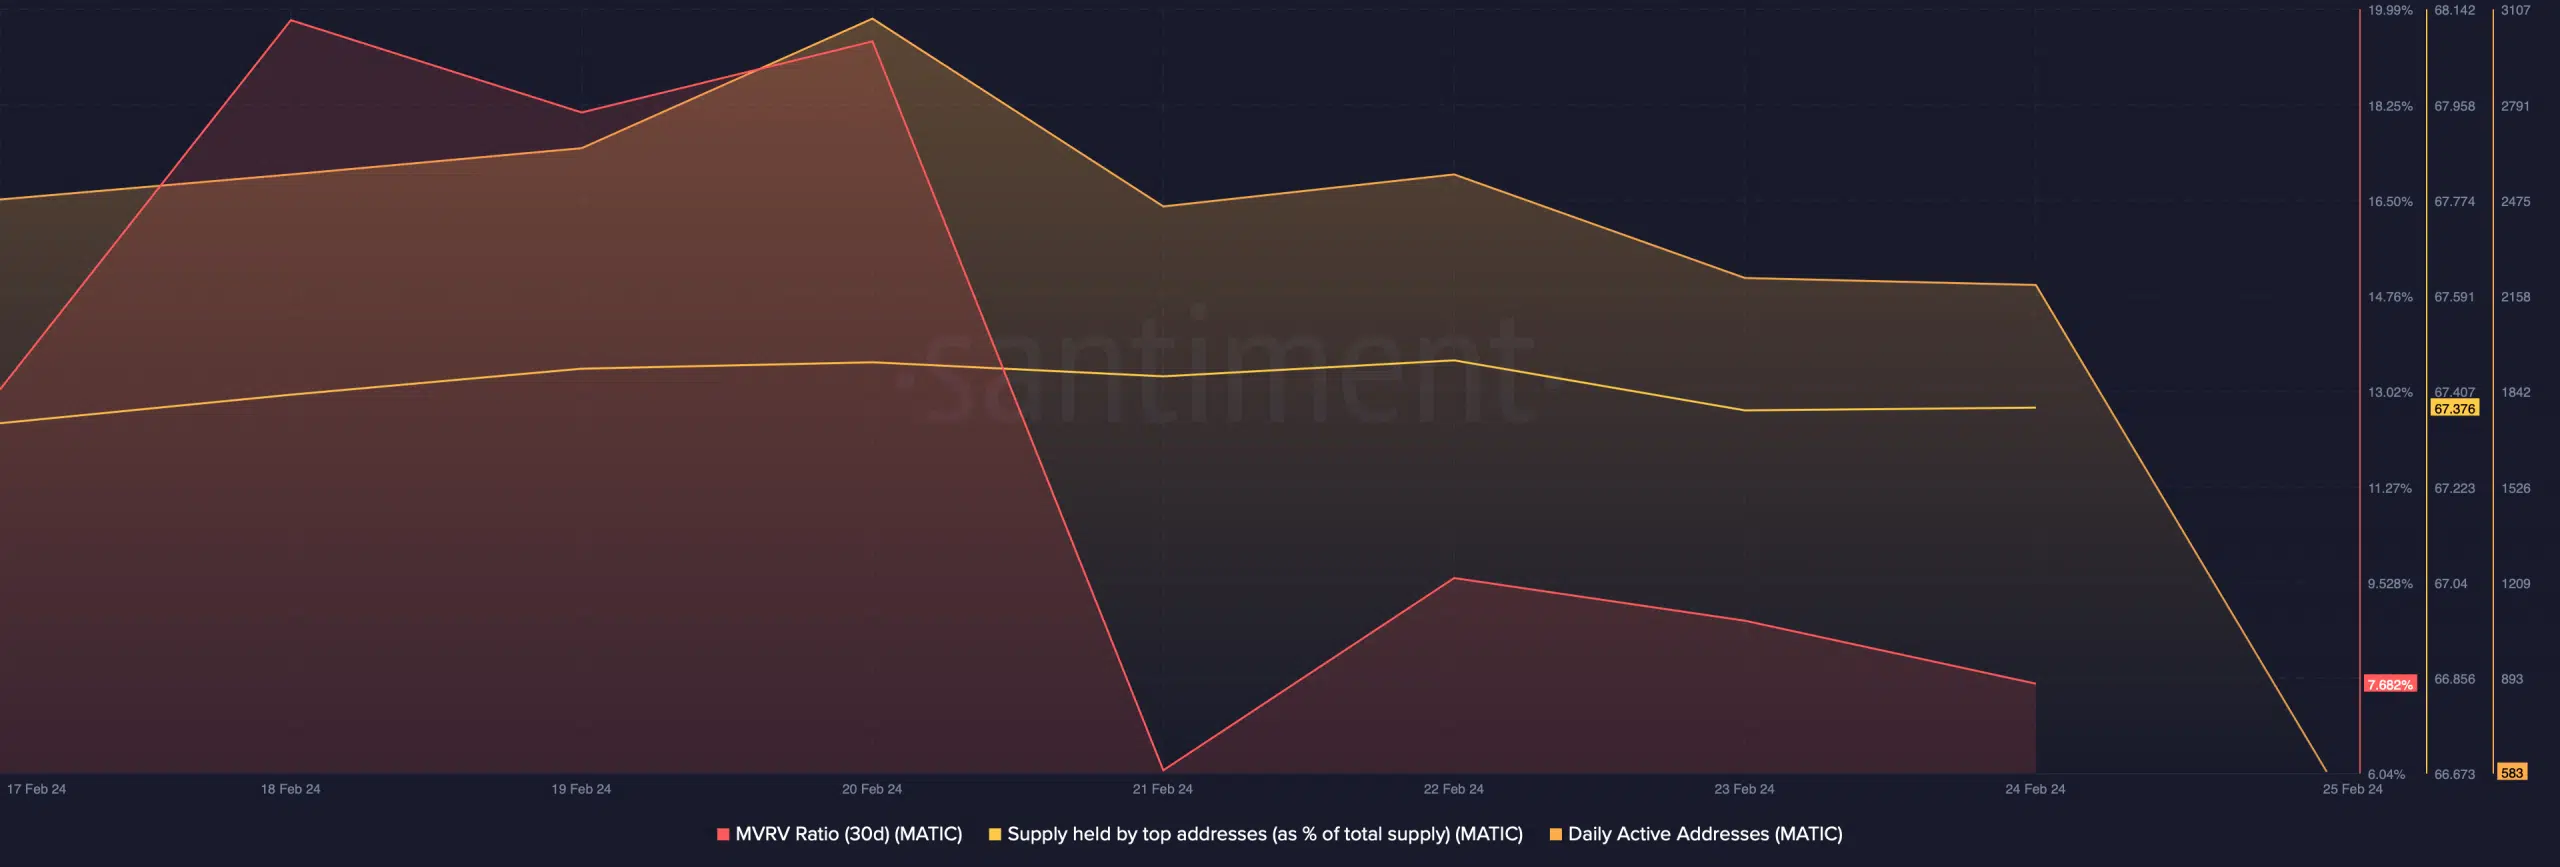
There was also a slight decrease in network activity, as indicated by a small drop in the number of daily active addresses. Furthermore, technical indicators like the MACD hinted at a possible bearish crossover, adding to the complexity of MATIC’s current market position.
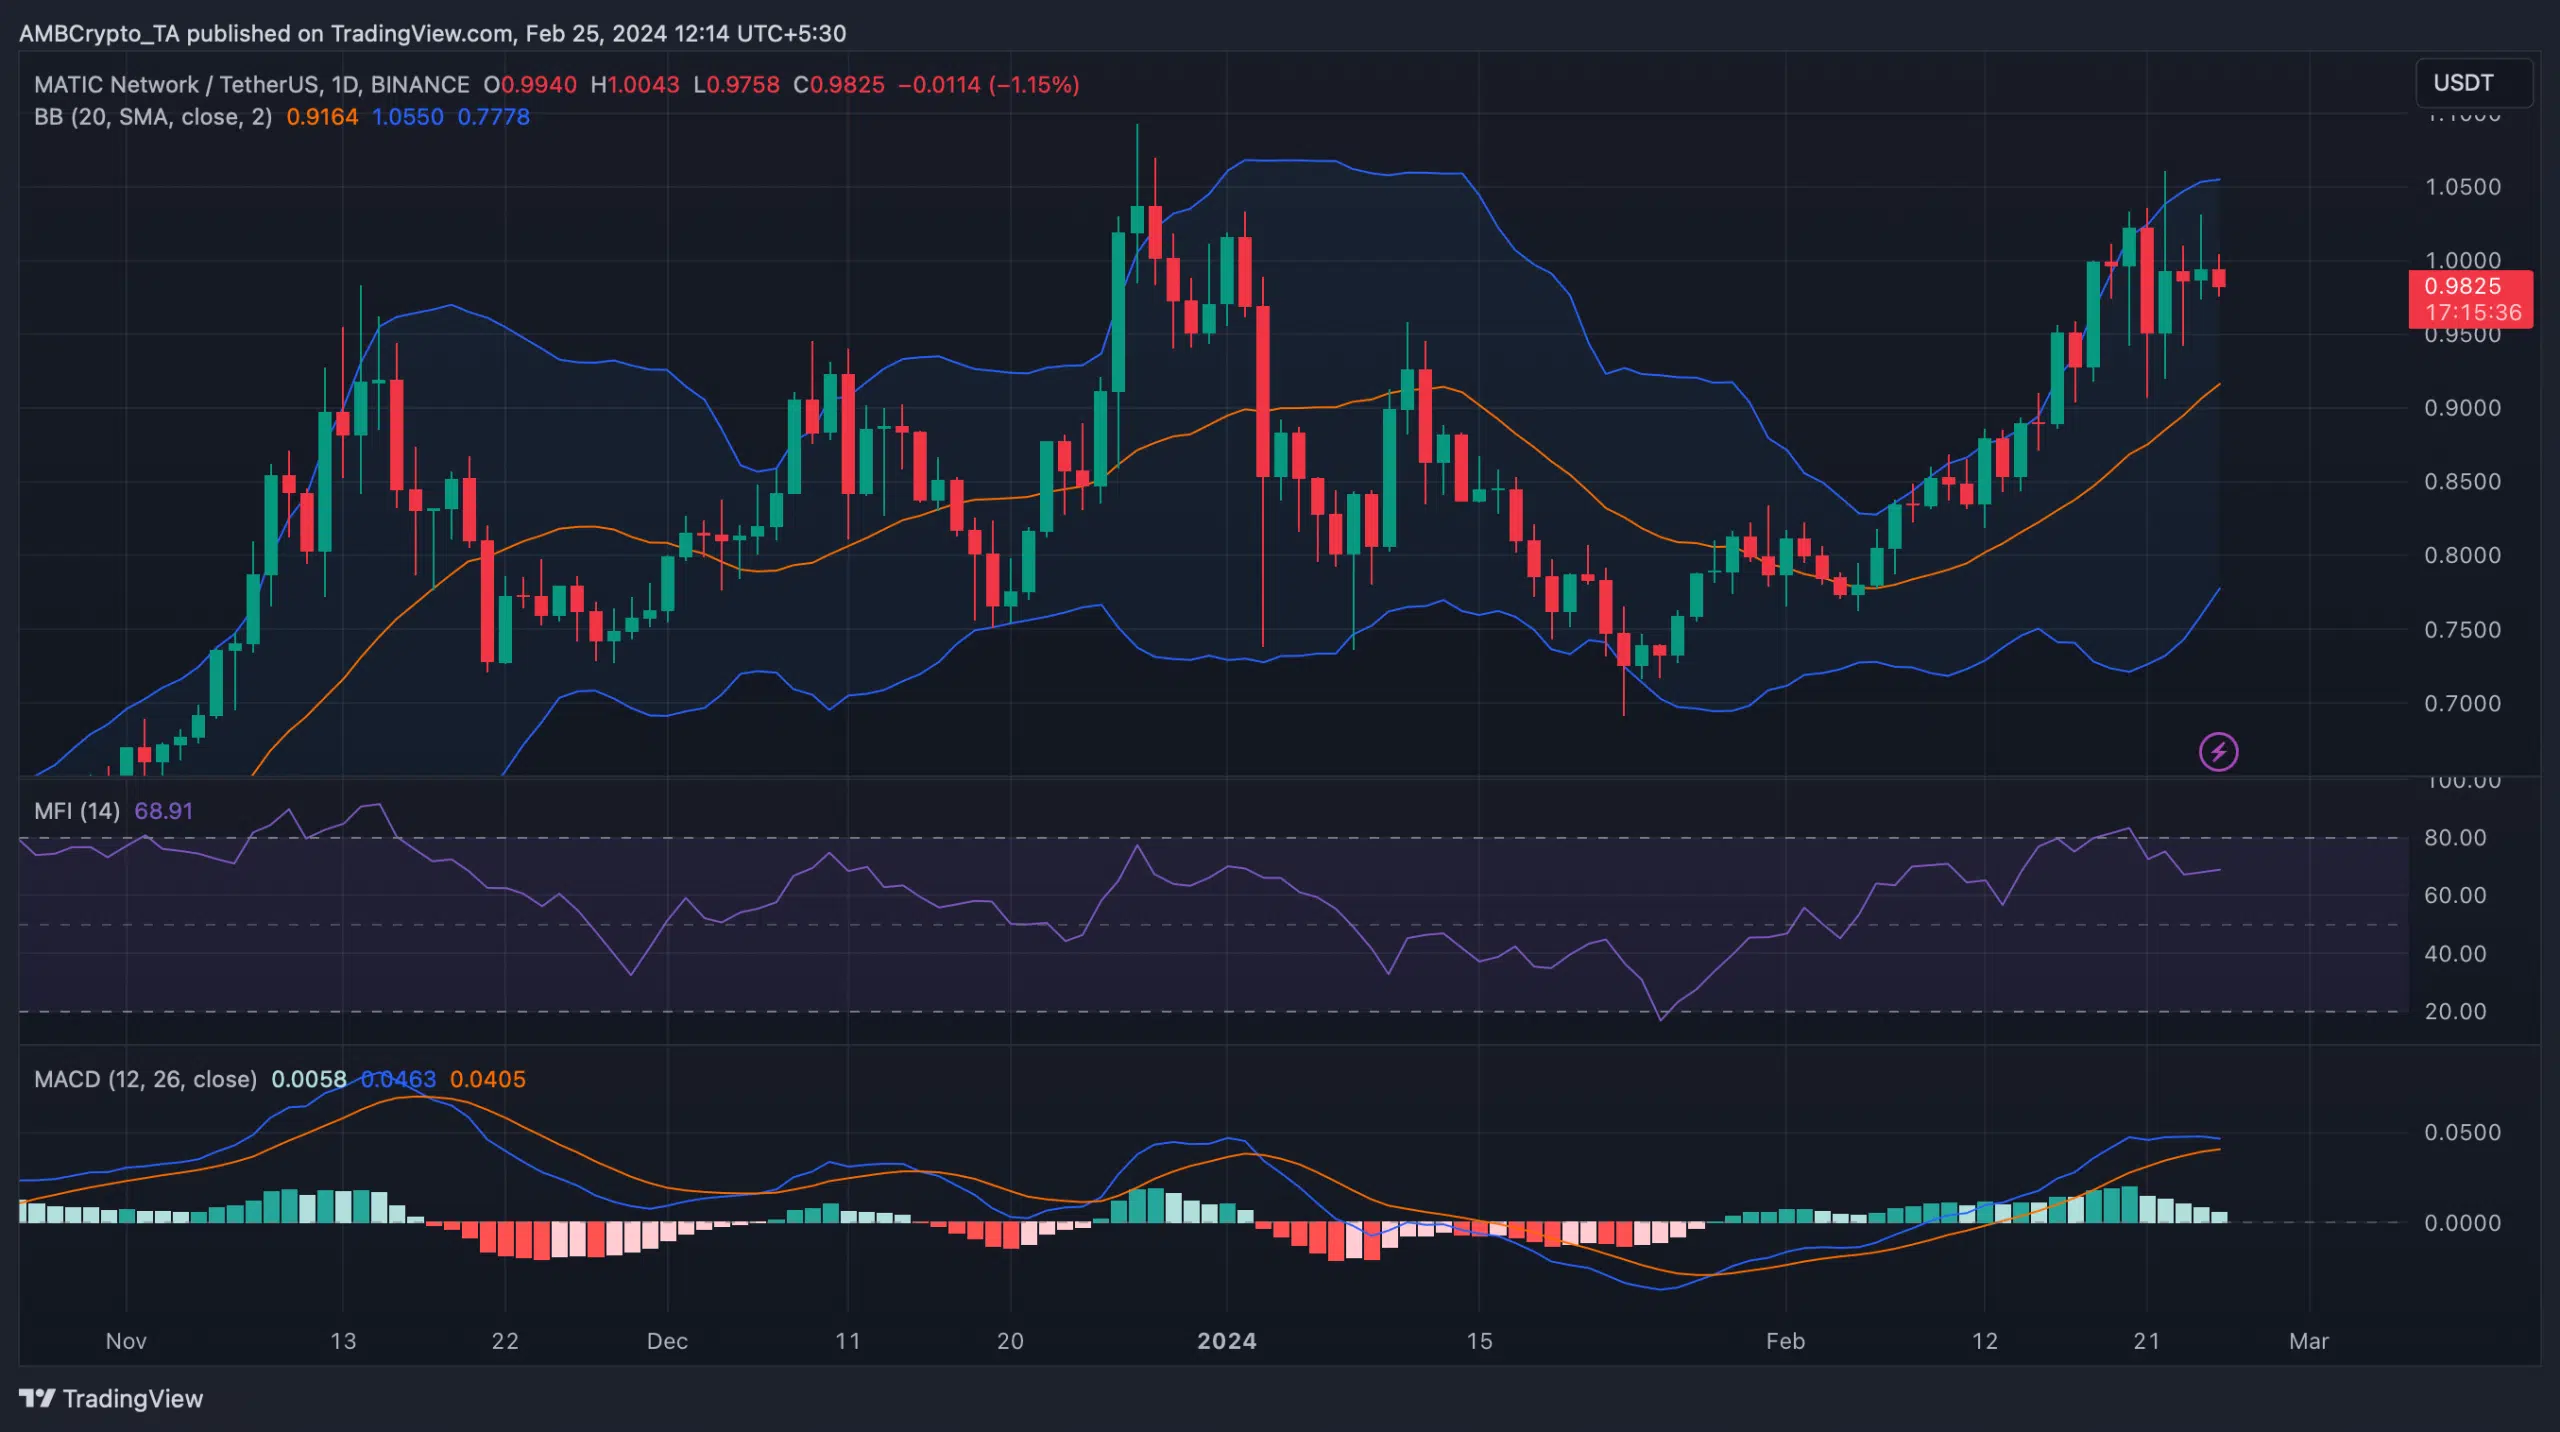
However, not all indicators were pessimistic. The Money Flow Index (MFI) maintained a position well above the neutral point, and MATIC’s price was still positioned above its 20-day Simple Moving Average (SMA).
This could offer the necessary backing for MATIC to recover, providing a glimmer of hope for investors seeking signs of the token’s enduring strength. To explore this development in more depth, you can watch the Youtube video below.