


- Cardano faces reduced active addresses, with daily activity dropping thirty percent annually, raising questions about sustained user interest.
- Both cryptocurrencies confront challenges, though Tron shows steadier price movement while Cardano struggles to reclaim former resistance levels.
Tron (TRX) and Cardano (ADA) are locked in a close contest for the ninth position in market capitalization. This rivalry has caught the attention of many traders, especially as ADA continues to hover below $1.
In recent weeks, on-chain indicators have hinted that Cardano’s network engagement is faltering, pushing some investors to consider TRON as a more dependable option.
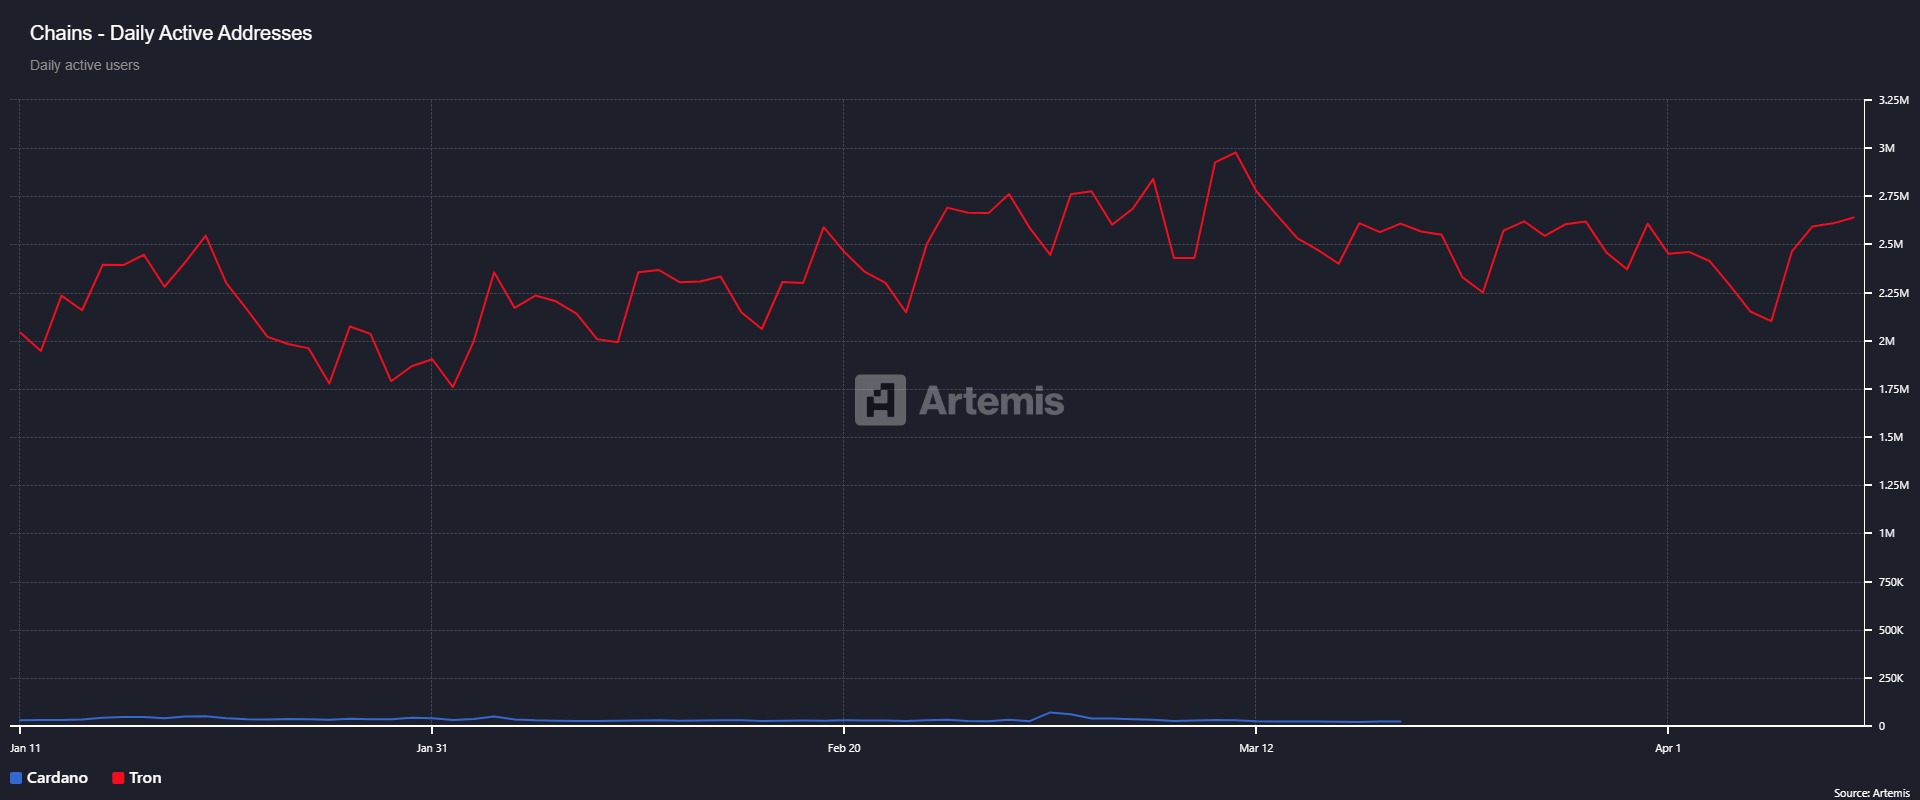
Moreover, blockchain statistics show that ADA’s daily active addresses have dropped 30.3% year-over-year, alongside a decline in fee generation to $8.1k. These figures suggest that user activity and capital inflows may be shifting elsewhere.
![]()
By contrast, TRON continues to benefit from strong stablecoin inflows. A recent $1 billion USDT mint on TRON helped strengthen its position as a go-to platform for digital settlements, possibly boosting TRX staking and overall utility.
Meanwhile, transaction data reveals a noticeable gap between the two networks. TRON’s daily transactions climbed 76.8% year-over-year to 9.1 million, whereas Cardano’s dropped by 38.8% to 28.7k.
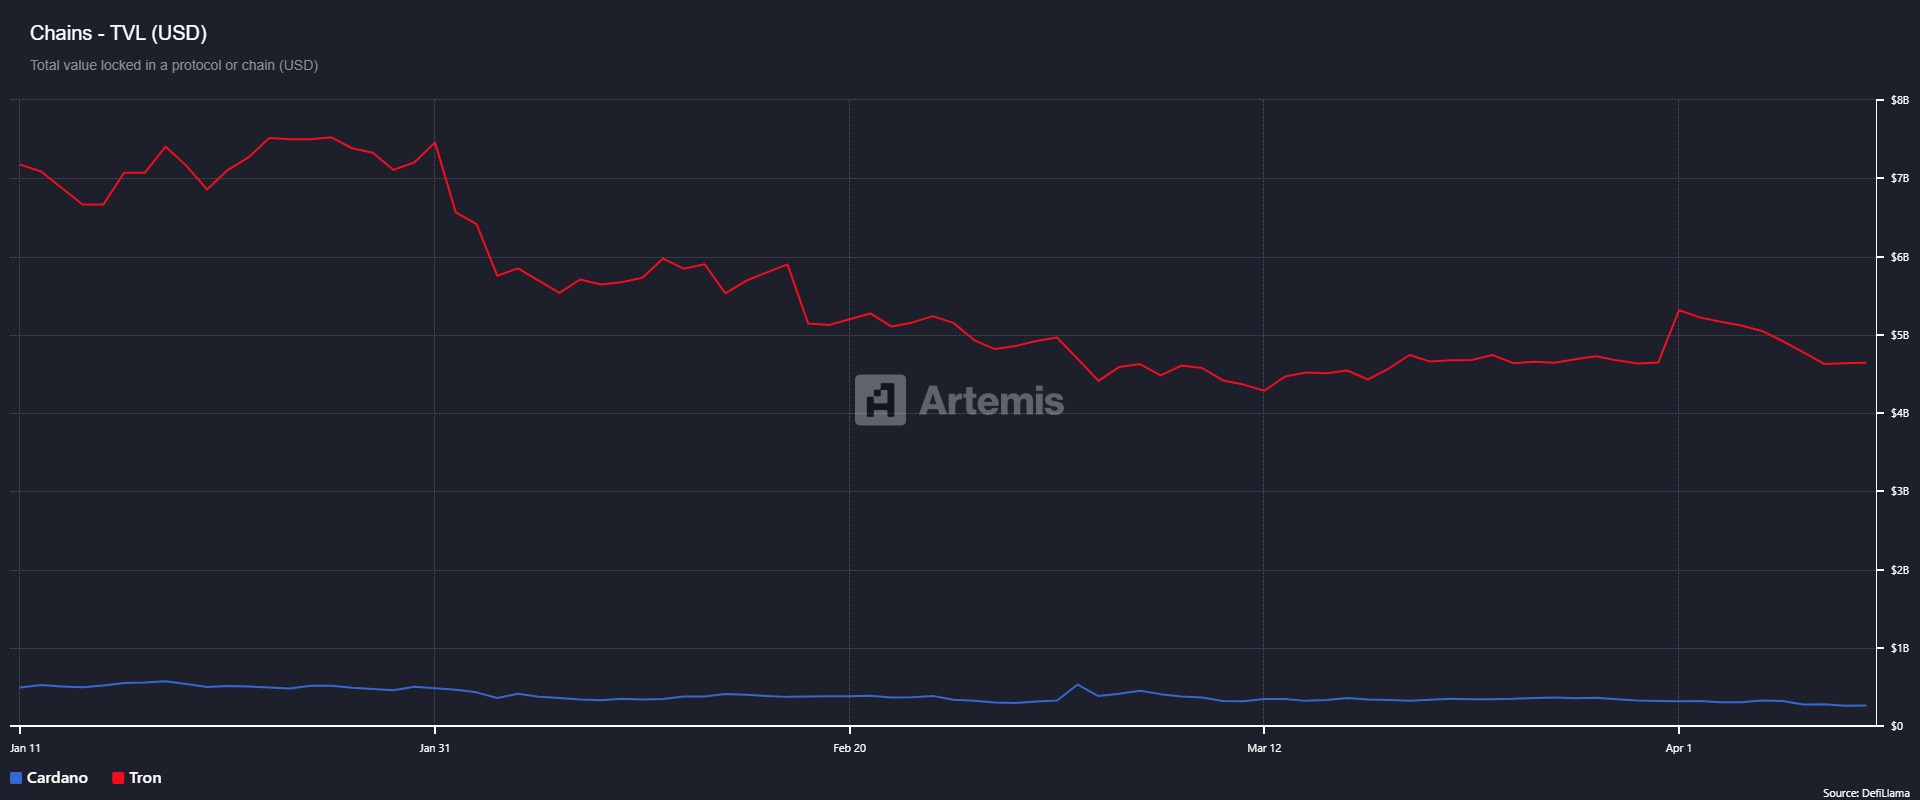
Even so, TRON’s Total Value Locked (TVL) slipped by 9% to $7.3 billion, which indicates that stablecoin concentration has not led to higher DeFi traction. Cardano, on the other hand, recorded a 17.4% rise in TVL, reaching $431 million and pointing to greater DeFi use.
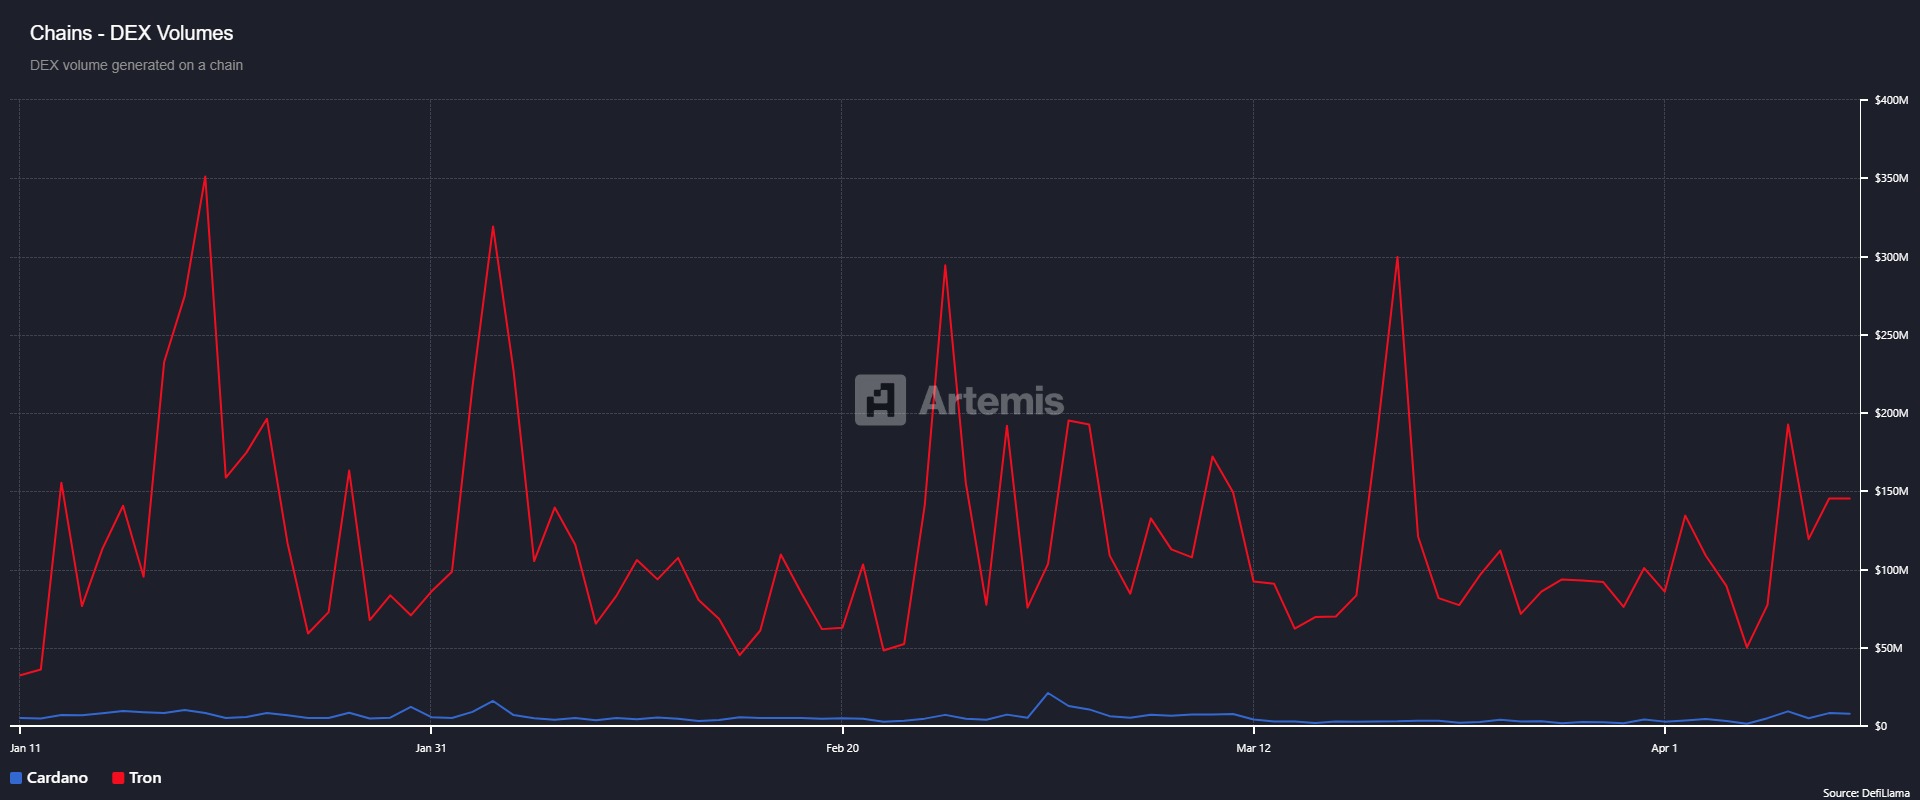
Despite TRON’s lag in DeFi growth, TRX trading volume rose by 179.4% in one day to $955.27 million. This uptick, paired with expanding address activity, highlights ongoing interest in the token.
Together, these developments illustrate that TRON’s broader appeal stems from its larger liquidity base, practical settlement function, and steady market presence.
Price Action further reflects the differences between ADA and TRX
ADA ended Q1 with a 21% decline, while TRX kept its drop to just 8%. During the past month, ADA slid by 15.63%, yet TRX managed a 7% climb. Both remain below their cycle peaks, suggesting many holders are dealing with unrealized losses.
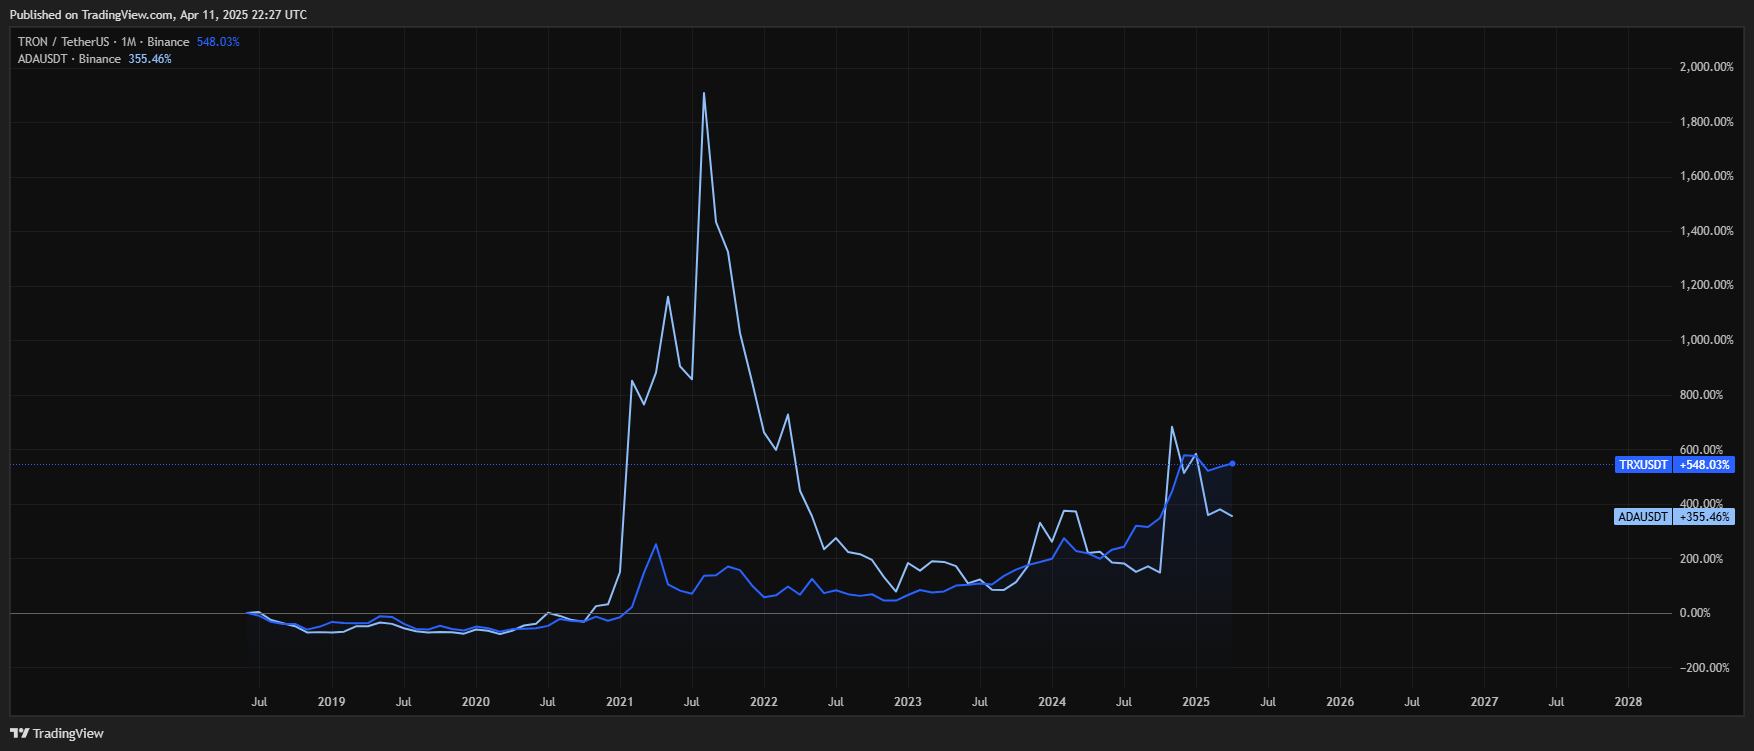
However, Cardano’s rising dormant coin movement raises the risk of additional sell-offs, especially as ADA tests established support zones. TRX, by comparison, has held its ground in the $0.25–$0.20 band for more than four months.
These metrics may signal that TRX is gaining traction at ADA’s expense, although each chain still faces broader market forces. If Cardano’s usage downturn persists, TRON’s settlement features and liquidity channels could continue to attract greater attention in this ongoing race for crypto market share.
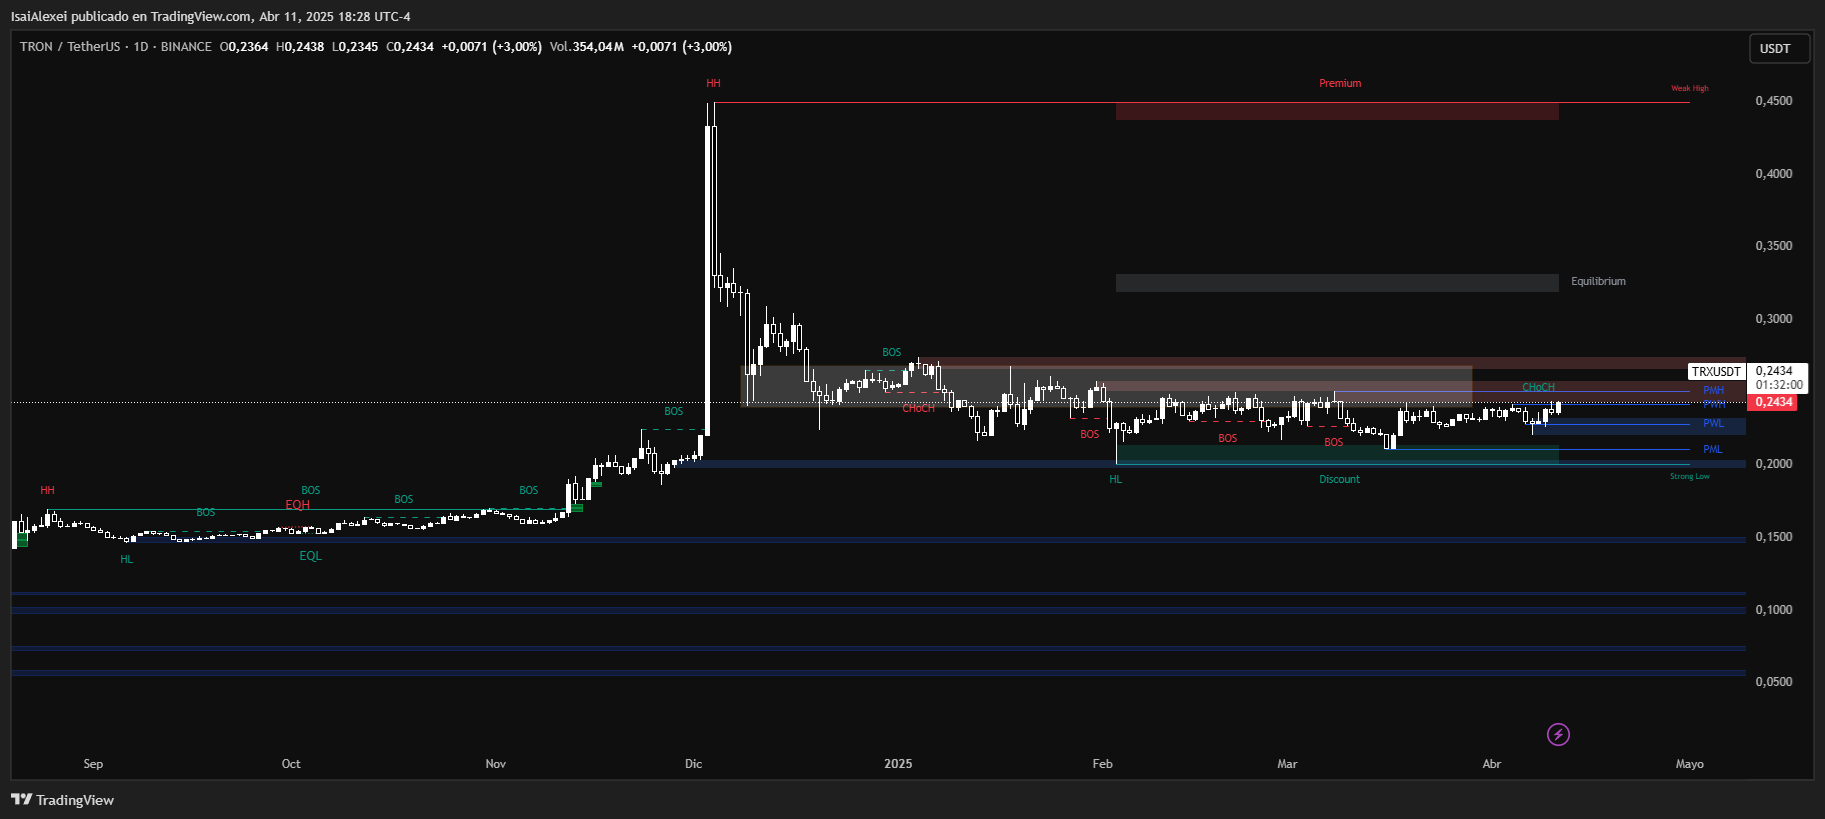
Tron (TRX) is currently trading at $0.2431, marking a 2.83% daily gain and showing a stable uptrend over the last month with an 8.08% increase. It has also delivered impressive long-term growth, climbing 105.06% over the past year and nearly 49% over the last six months, which positions TRX as one of the more resilient altcoins during broader crypto market corrections. This stability has been bolstered by Tron’s significant role in the stablecoin settlement ecosystem and expanding DeFi infrastructure.
Technically, TRX is approaching a critical structure zone where previous rallies have encountered resistance near $0.25. If price action decisively breaks this level, the next upward target could be $0.27.
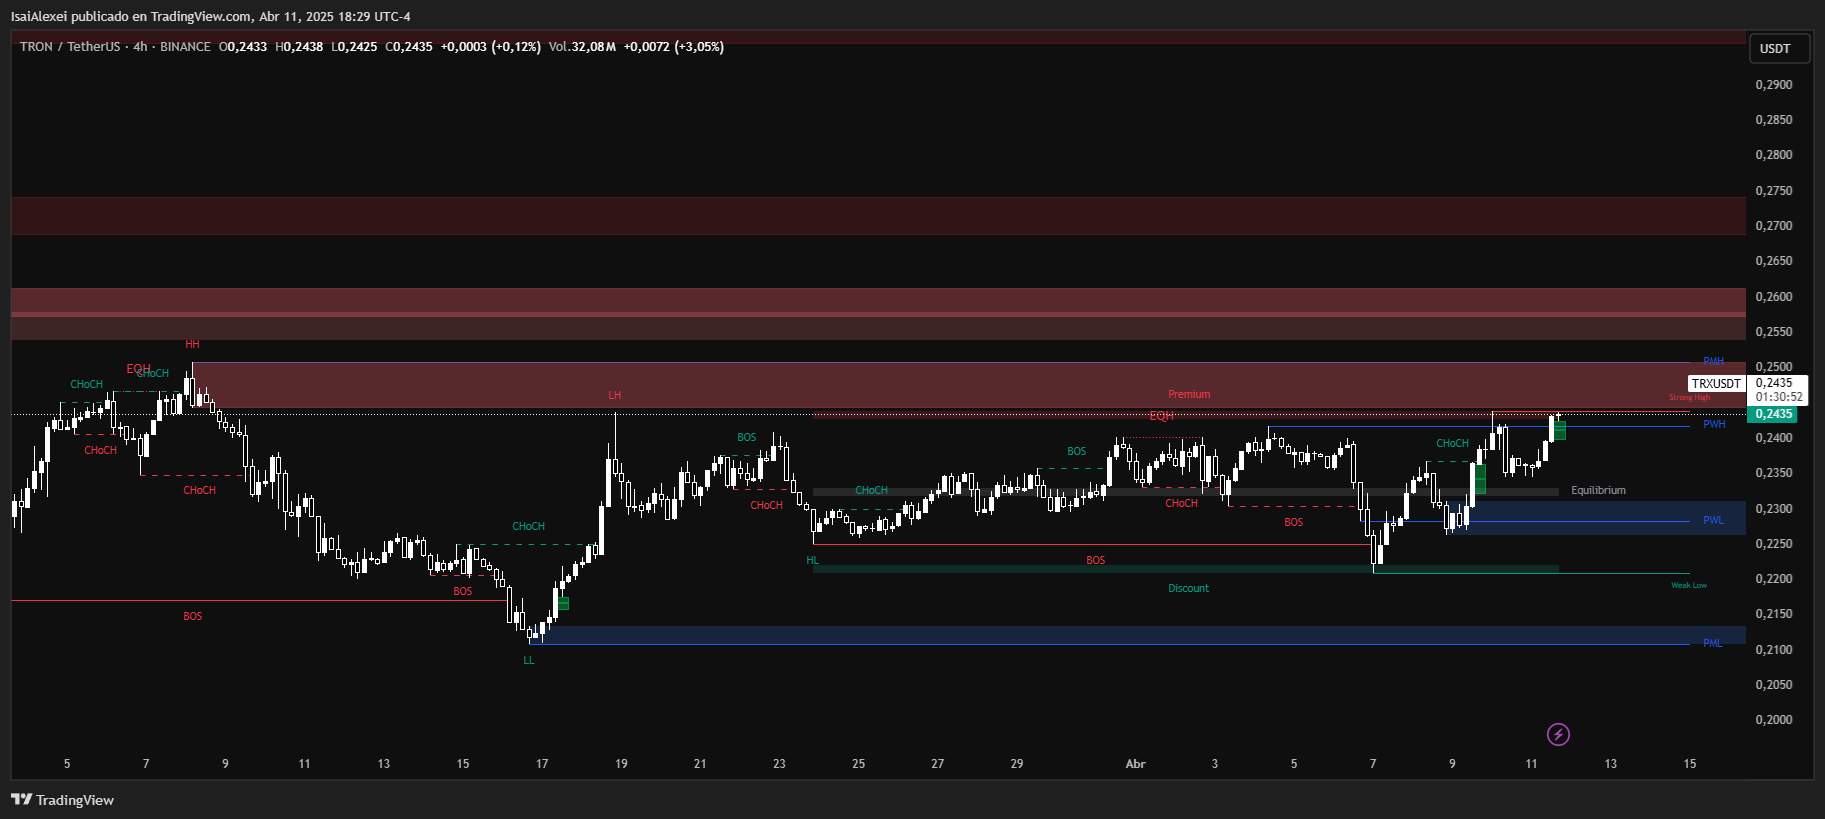
The trend remains supported by a bullish ascending channel, and the relative strength index (RSI) does not yet indicate overbought conditions, suggesting further upside potential. Market sentiment is also influenced by speculation around a potential Tron ETF and TRX’s potential to surpass Dogecoin in market cap rankings.

Cardano (ADA) is currently trading at $0.628, showing a 3.10% gain over the past 24 hours. Despite the positive daily move, ADA remains under moderate pressure on the weekly (-3.44%) and monthly (-13.21%) timeframes, reflecting broader market consolidation. H
owever, it has delivered a solid 77.91% return over the past six months, signaling strong medium-term accumulation. The immediate resistance zone is at $0.65, with potential upside toward $0.71 if momentum continues building.
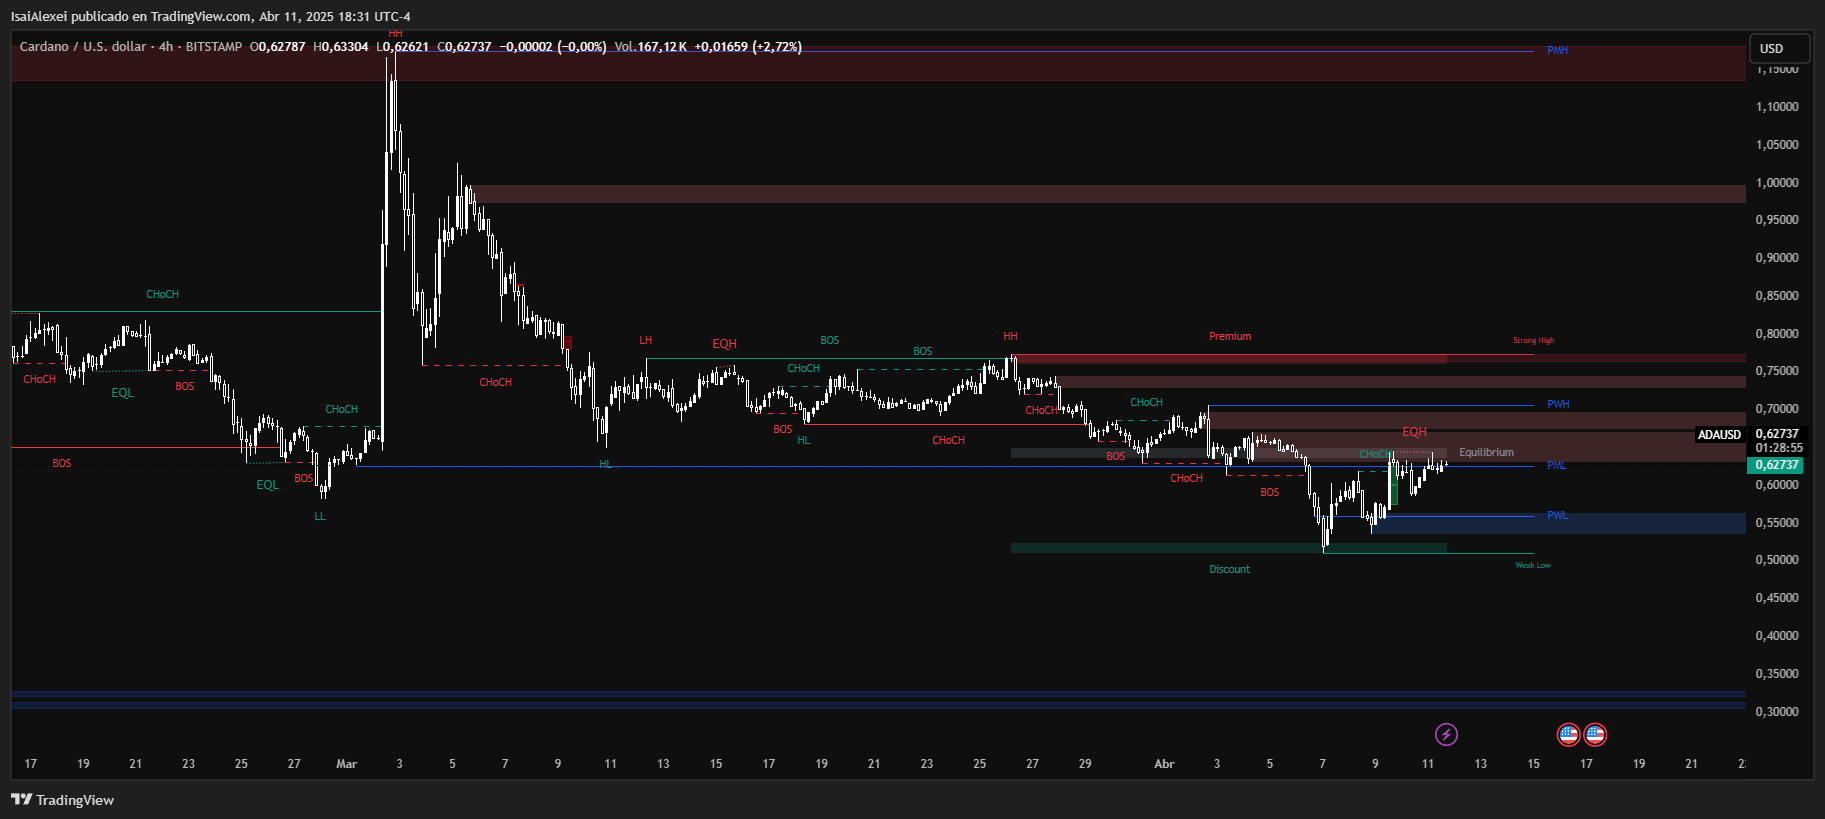
From a technical standpoint, ADA is rebounding from the lower range of a consolidation pattern, and the presence of buying volume at the $0.60–$0.62 zone suggests active demand. Oscillators are neutral, while moving averages still lean slightly bearish—indicating that ADA must break through overhead resistance to confirm a trend reversal.