- SHIB faces key resistance at $0.0000100; a breakout could push its price 30% towards $0.0000125.
- A decline below $0.00000920 could mean a 20% drop for SHIB, testing support at $0.00000800.
The price of Shiba Inu (SHIB) has managed to capture the attention of traders and enthusiasts, experiencing an impressive rise after overcoming diagonal resistance just over a week ago.
Now, SHIB is facing a critical challenge, facing an intersection of horizontal and Fibonacci resistance. This begs the question: Will it manage to break through these limits?

Recovering Previous Support
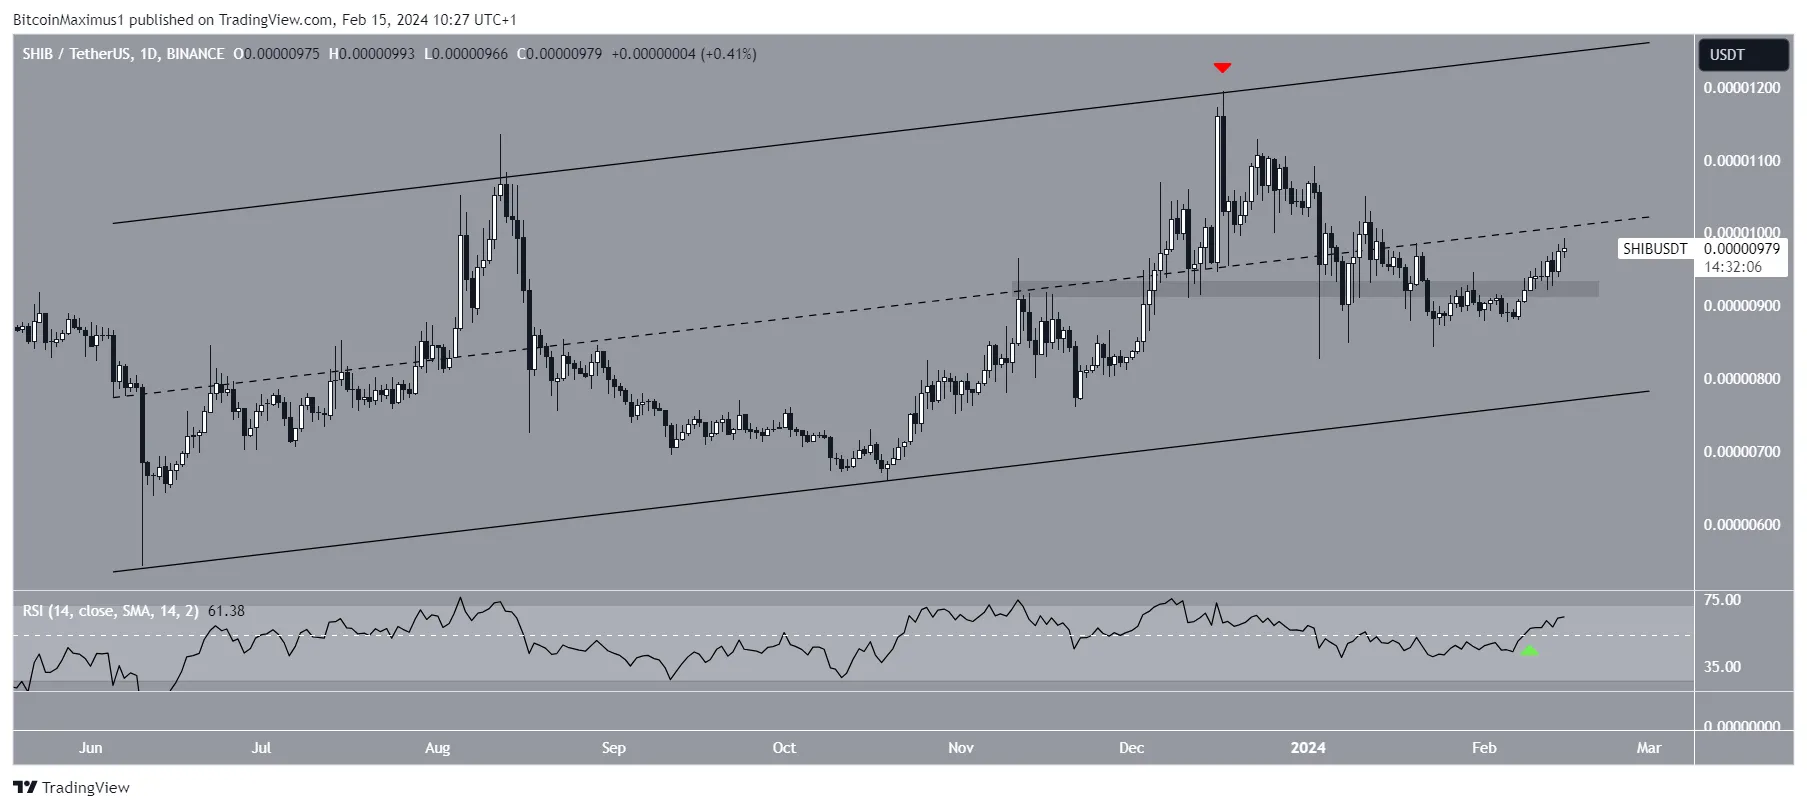
Since mid-year, Shiba Inu has marked its path within an ascending channel, reaching a high in December 2023. Despite this achievement, it suffered a pullback that led it to lose essential support, although this situation was brief and the price quickly reestablished itself.

At the moment, SHIB is approaching the median of the channel, and although it has not yet managed to break above it, market indicators such as the daily Relative Strength Index (RSI) suggest a positive trend.
The RSI, a key tool for investors looking to gauge price momentum, signals a bullish environment at above 50. This indicator is vital for identifying times to buy or sell, depending on whether the asset is perceived to be overvalued or undervalued.
SHIB Price Expectations: Are we facing an Imminent Outperformance?
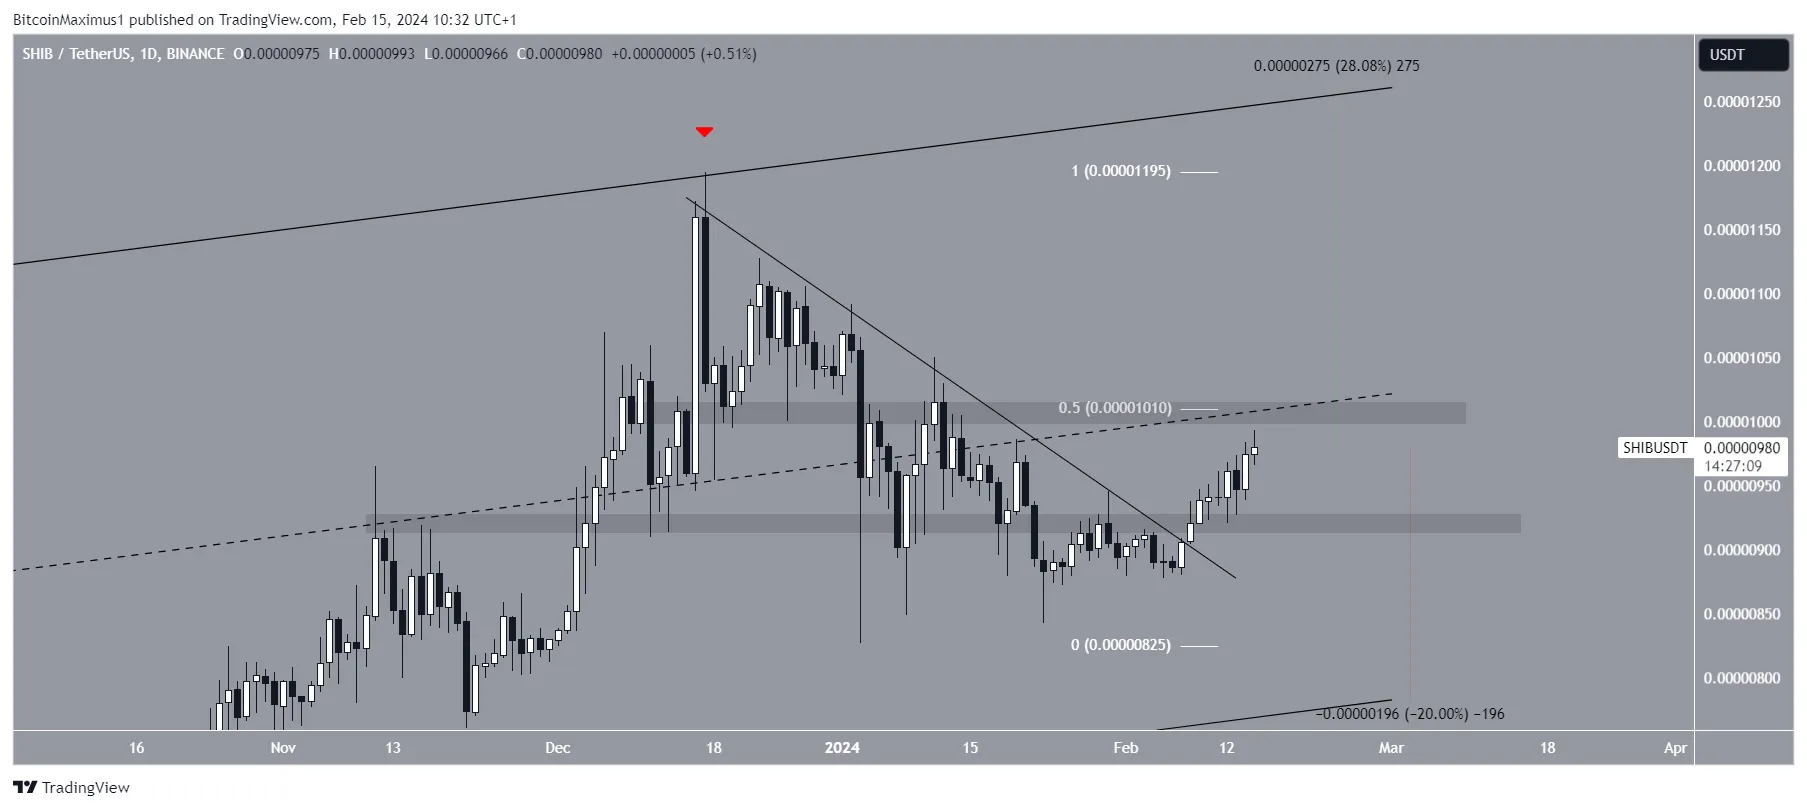
Taking a closer look, SHIB broke through a downward resistance line on February 9 , which propelled its value higher. Currently, it is running into robust resistance at $0.0000100, delineated by the 0.5 Fibonacci resistance, the median of the channel and a horizontal resistance area. This level will determine the direction of SHIB, which may lean towards a positive or negative trend.

A successful break of these barriers could propitiate a 30% advance towards the channel resistance line at $0.0000125. However, if price falls below $0.00000920, it would unwind the current uptrend, triggering a possible 20% drop to upward support at $0.00000800.
SHIB’s current situation raises high expectations in the market. The strategy for investors and analysts is to keep a close eye on support and resistance levels, in addition to paying attention to market indicators such as RSI.


