


- Trading volume for Solana drastically falls to $1.08 billion, signaling decreased investor engagement and market activity.
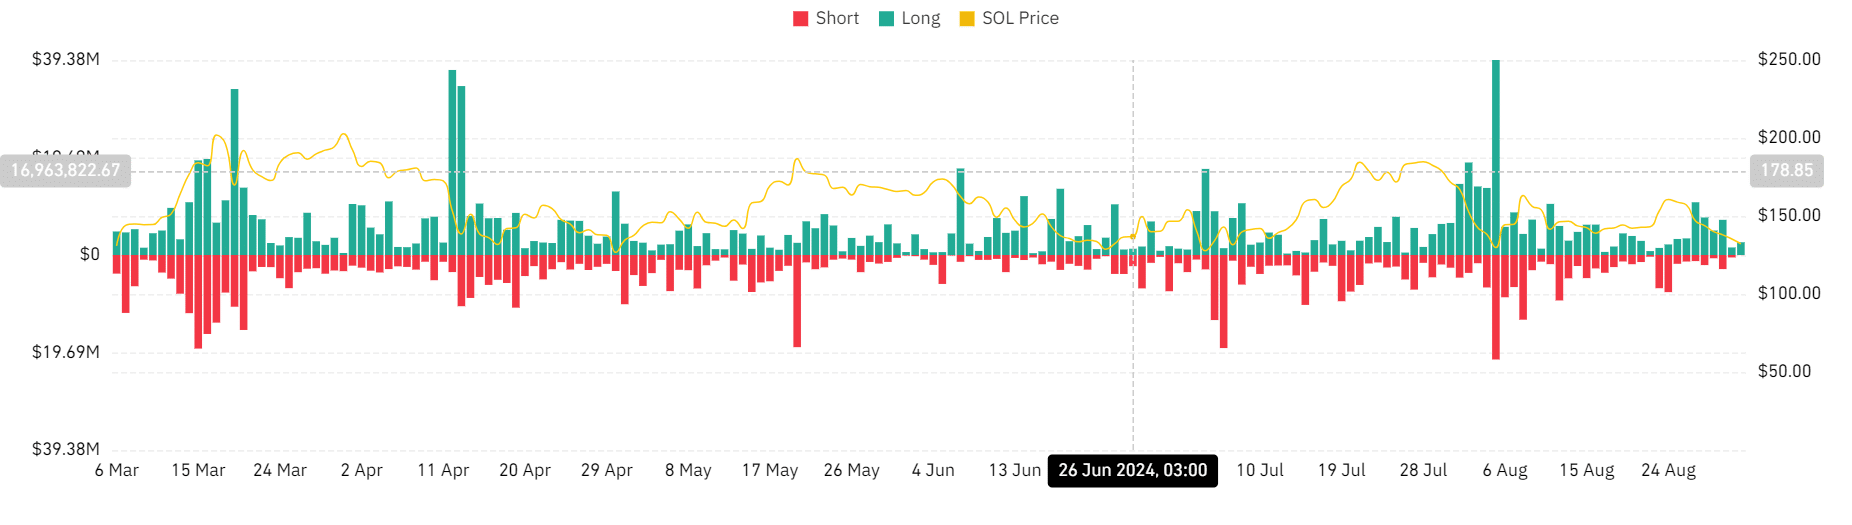
- Long position liquidations at $2.57 million indicate prevailing bearish sentiment, overshadowing short positions at just $28.9k.
In the recent financial evaluations, Solana has witnessed a noticeable decrease in its market value. As of the latest trading sessions, Solana is priced at $131.11, reflecting a 5.02% decline in its daily trading value.
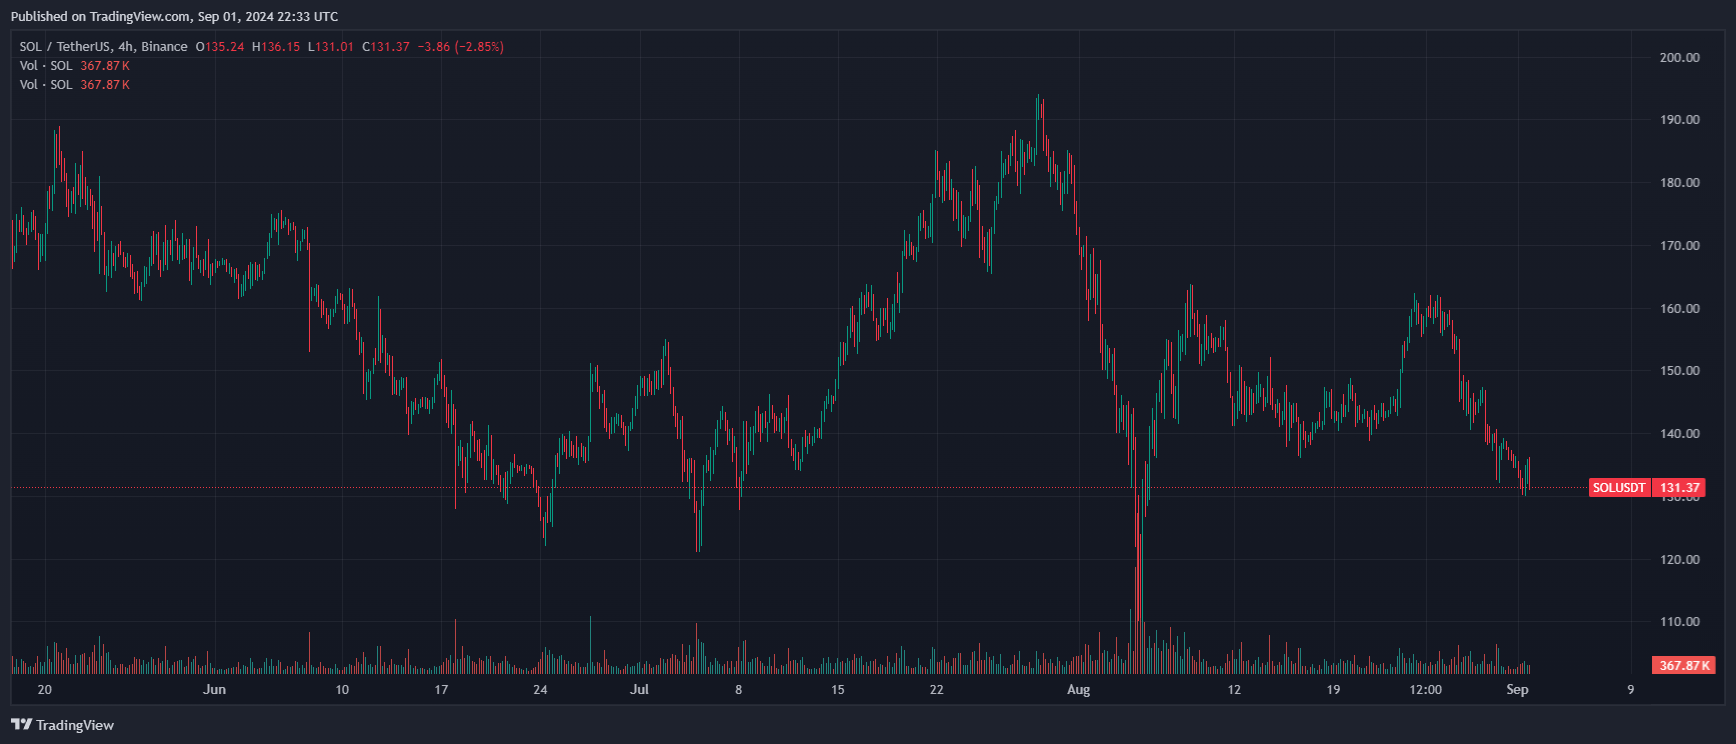
Over the previous week, the cryptocurrency saw a 18.17% reduction, culminating a month of substantial losses where it shed over 21% of its market value.
The trading volume for Solana also experienced reduction, halving from earlier figures to $1.08 billion. This downturn in trading activity correlates with broader market sentiments that foresee further declines.
$SOL IS IN THIS MASSIVE 6-MONTH-LONG BEAR PENNANT.
— One of the cleanest HTF bear pennants I have ever seen.
+-4/6weeks, the next downtrend leg will resume. pic.twitter.com/3P5wbDVtX1
— Scient (@Crypto_Scient) August 31, 2024
Crypto-Scient, a cryptocurrency analyst, has pointed to a bearish pattern extending over six months, suggesting that the price may continue to drop.
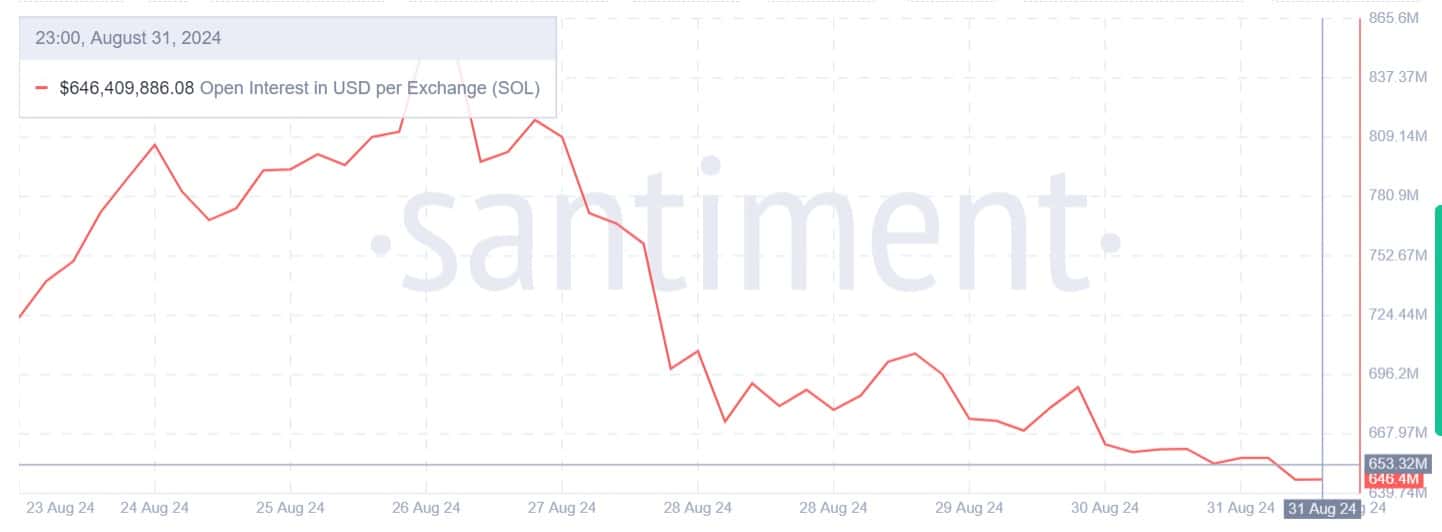
This bearish trend is further evidenced by the decrease in Open Interest in Solana, which moved from $857 million to $646 million in the past week, indicating that fewer investors are initiating new positions.
This shift is largely interpreted as a signal of diminishing confidence in Solana’s immediate price prospects.
ETHNews Market analysis shows an imbalance in long and short position liquidations, with long positions liquidations amounting to $2.57 million, overwhelmingly surpassing the $28.9k in short positions.
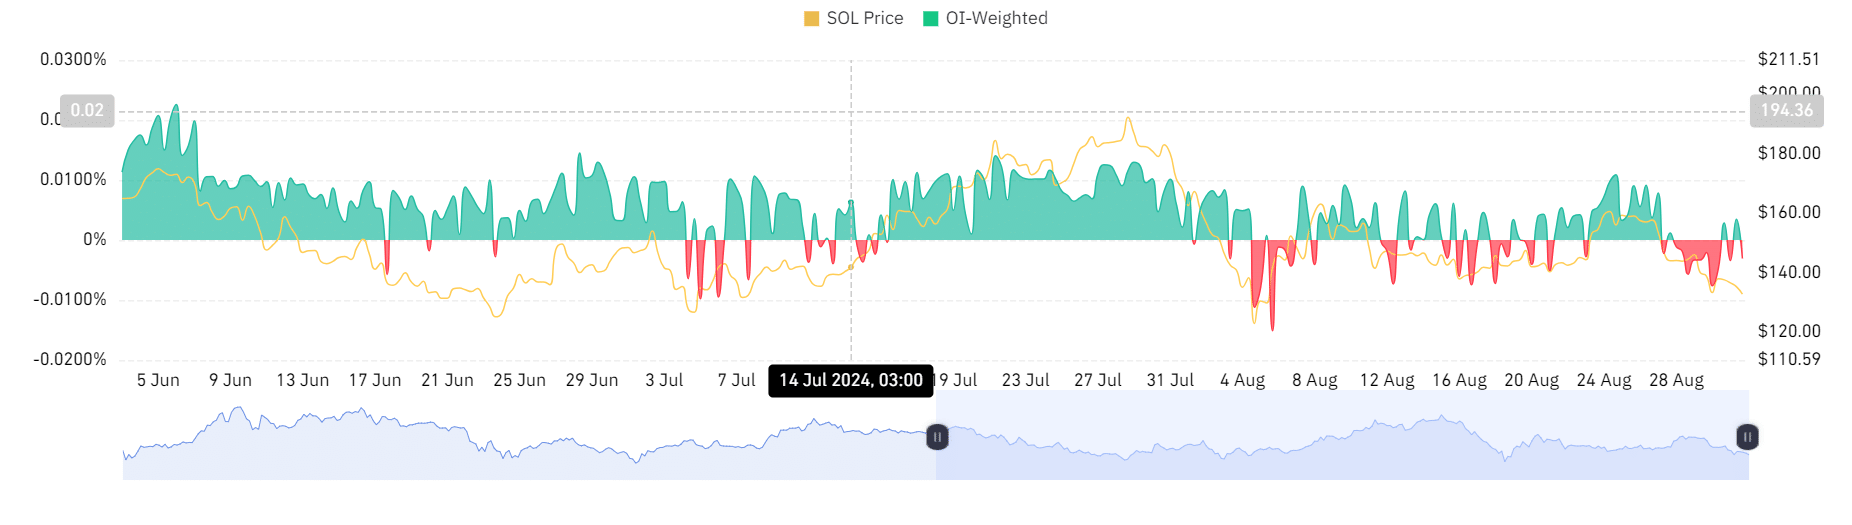
Moreover, the negative reading in the OI-weighted funding rate at -0.0031% reflects a decreased appetite for long positions, typically associated with expectations of rising prices.
Given these indicators, the current sentiment around Solana is predominantly bearish. The technical patterns, specifically the observed bear pennant, suggest that Solana’s price might soon test lower thresholds.
Analysts are closely watching the $110 level as a potential new low if the existing conditions persist.
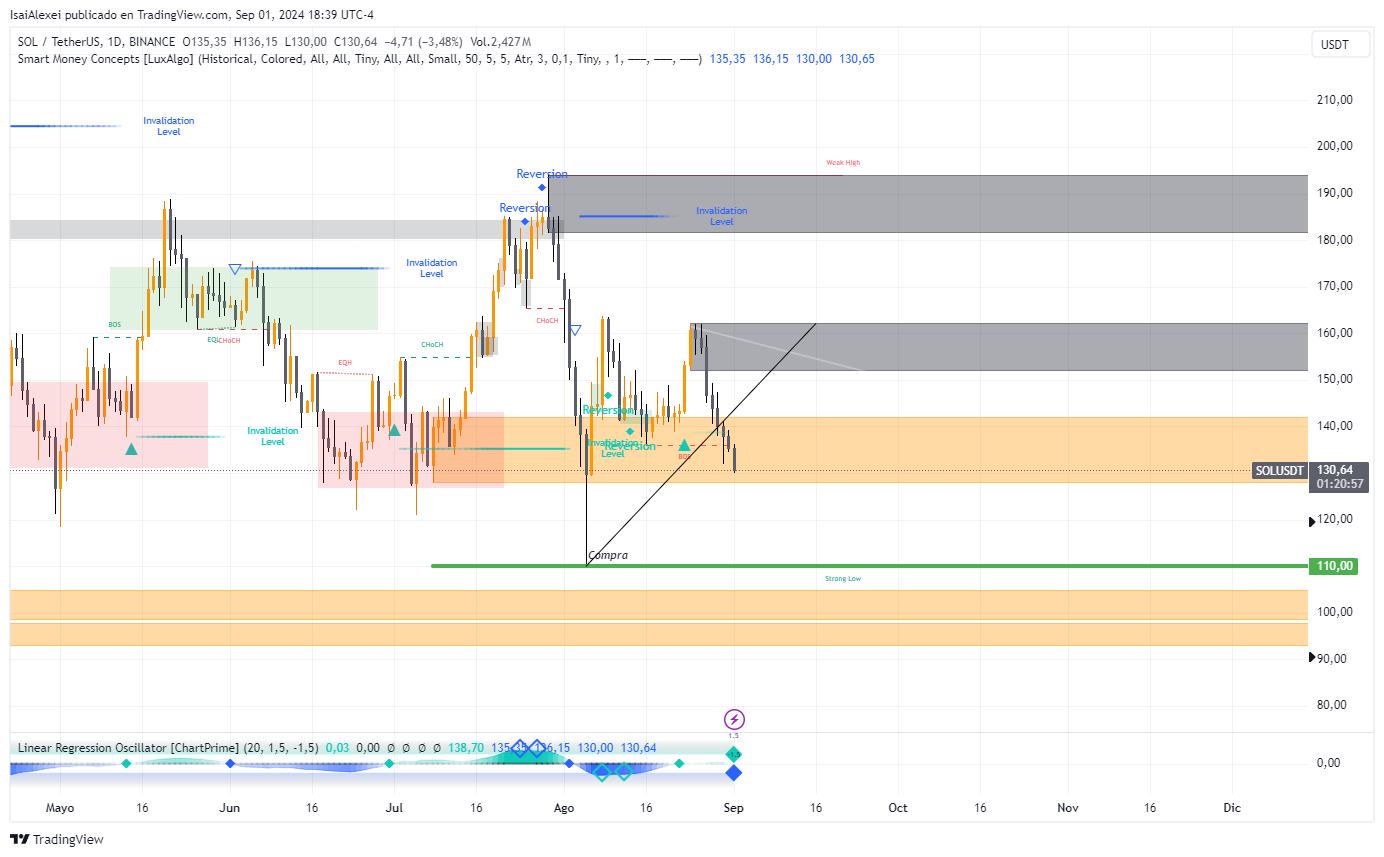
This level is considered critical as breaking below it could confirm a sustained downward trajectory for Solana, affecting both short-term trading and long-term investment perspectives.
SOL Key Support and Resistance Levels
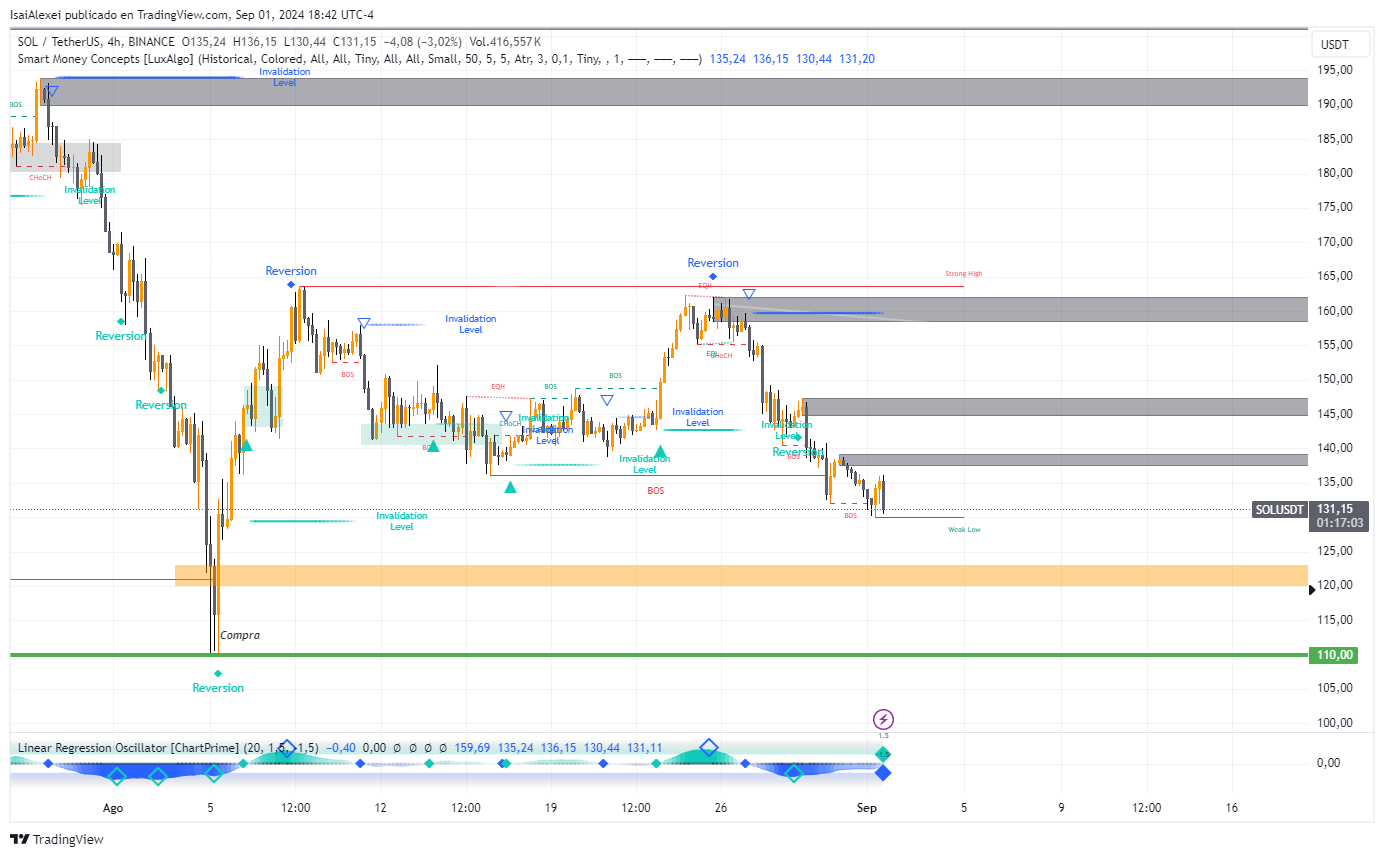
The support level on a monthly basis is around $120 USD. This has historically acted as a strong demand zone where buyers have previously stepped in. The major resistance level is around $150 to $160 USD, where selling pressure has previously emerged.
Moving Averages
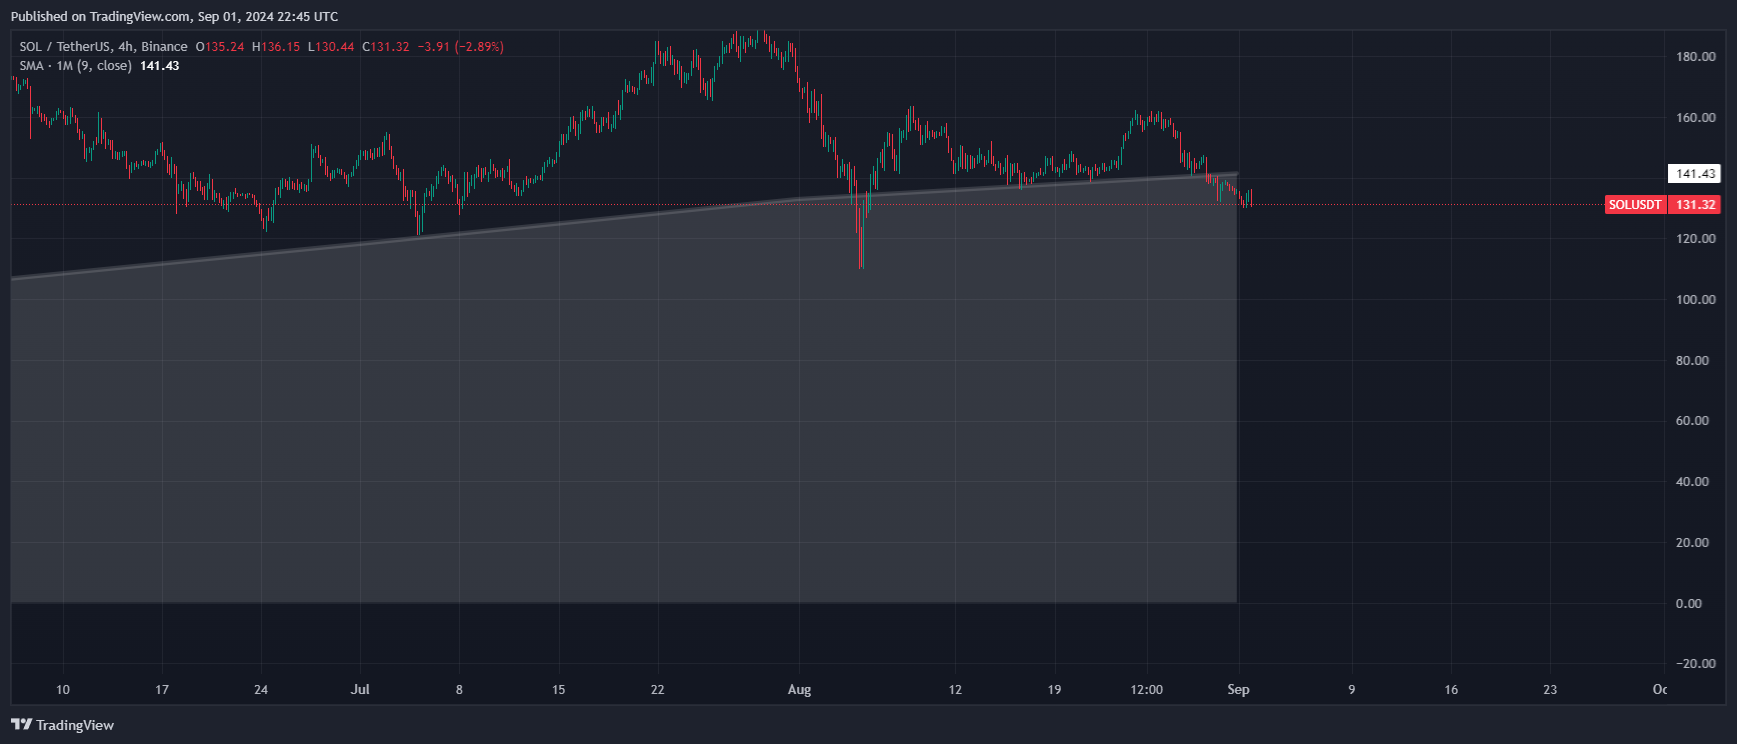
Simple Moving Averages (SMA):
- The 20-month SMA is currently trending below the current price level, suggesting that the long-term trend is still in a bullish phase, but recent price action has tested this moving average, indicating caution.
- The 50-month SMA is still in an upward trajectory, supporting the idea that the long-term trend remains intact.
Exponential Moving Averages (EMA)
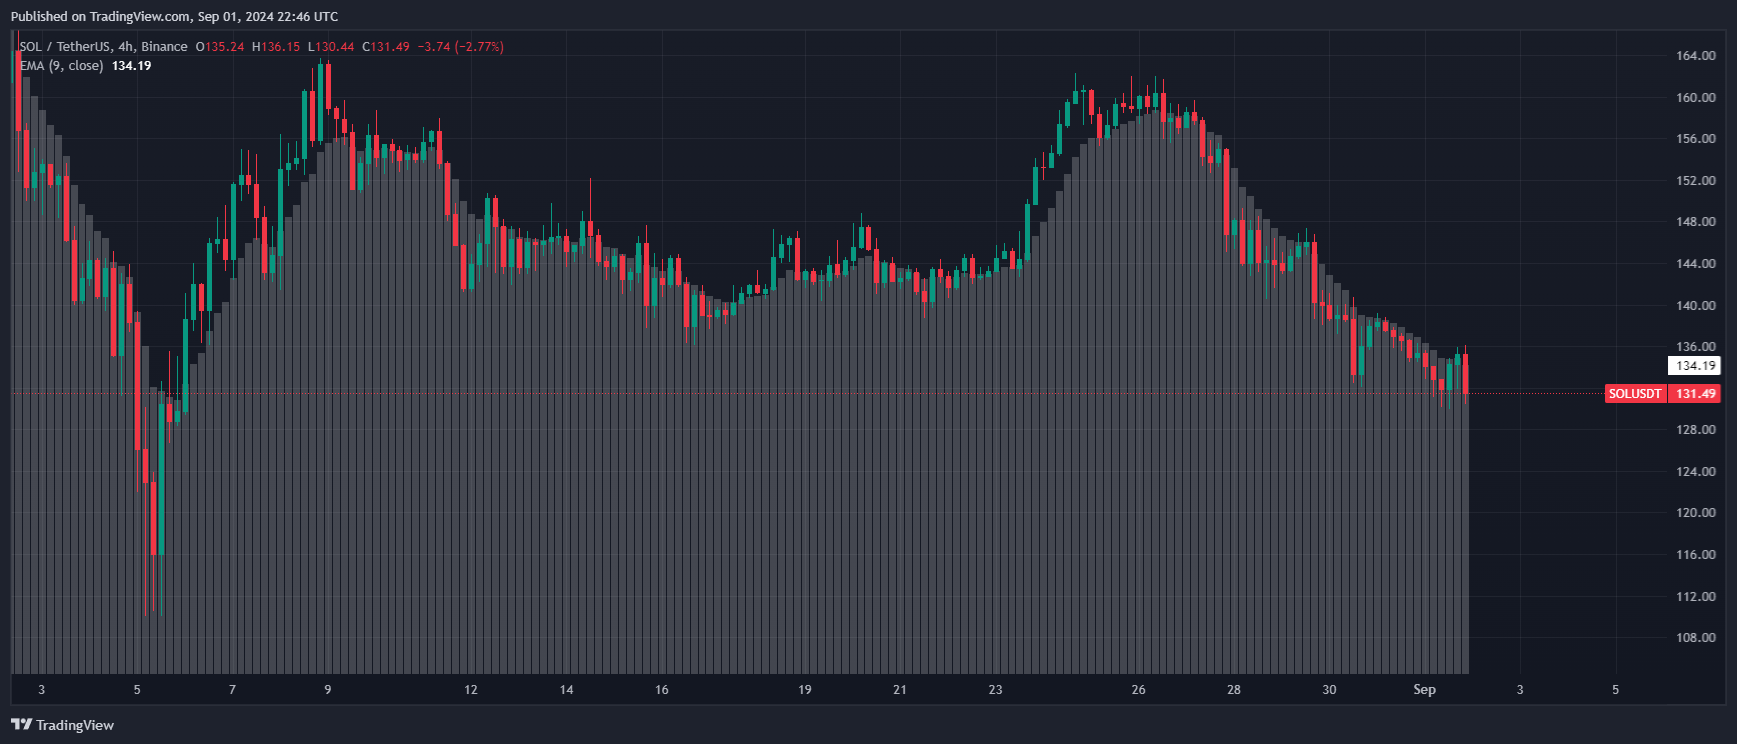
The 20-month EMA has flattened out, reflecting the consolidation phase. A cross below this level could signal a shift in momentum.
Relative Strength Index (RSI)
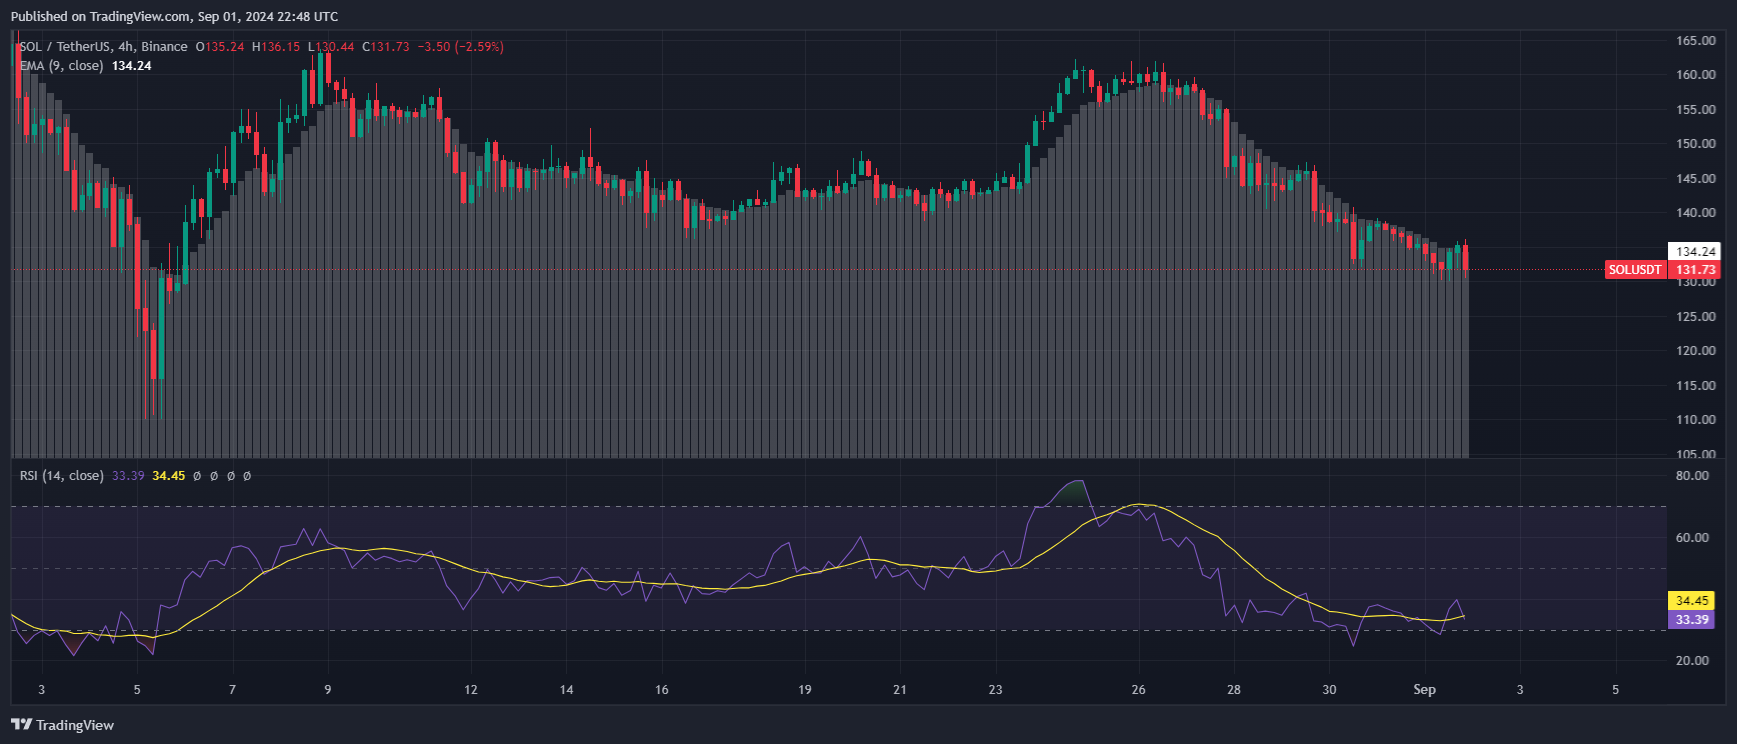
The RSI on a monthly chart is hovering around the 50-60 level. This range suggests a neutral zone, indicating that Solana is neither overbought or oversold.
A drop below 50 could signal bearish momentum, while a rise above 60 could confirm bullish continuation.
Moving Average Convergence Divergence (MACD)
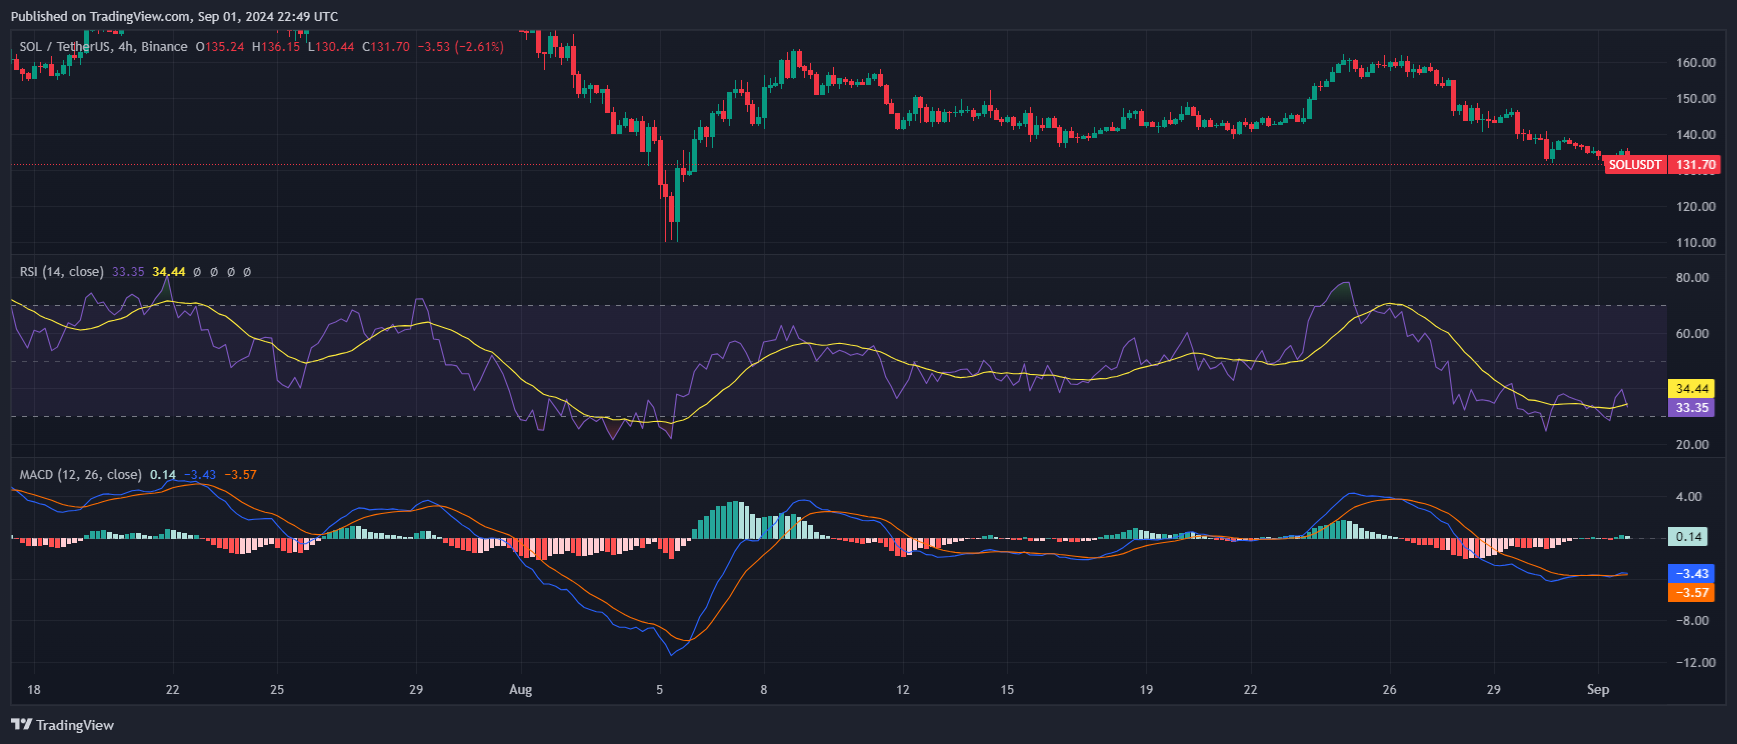
The MACD line on the monthly chart is flattening, converging towards the signal line. This convergence suggests weakening bullish momentum.
A bearish crossover of the MACD line below the signal line could indicate a potential downward trend or a bearish phase.