


- Bitcoin reclaimed $111,300 into the weekly close, but analysts caution that failure to clear the $112K–$113K resistance could send prices back to $100,000 in a worst-case scenario.
- Fibonacci models suggest such a dip would be limited to 10% and could set the stage for a broader rally toward $150,000.
Bitcoin climbed back above $111,000 into Sunday’s weekly close, showing signs of recovery after last week’s dip, but analysts warn that a retest of $100,000 remains possible if key resistance levels fail to break.
BTC Holds $110K, Faces Resistance Ahead
Data from TradingView showed BTC/USD touching $111,369, up about 1% on the day. The move followed a volatile week sparked by U.S. macroeconomic data but crucially saw bulls defend the $110,000 support zone.
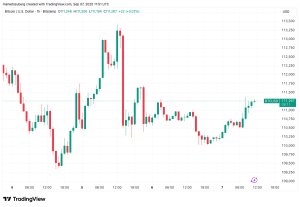
Crypto analyst Michaël van de Poppe described the rebound as “promising,” noting that Bitcoin made a higher low and preserved key support. “Would be great if we crack $112K and fire up the bull run,” he posted on X.
This is actually promising on $BTC.
It makes a new higher low and holds the support at $110K.
Would be great if we crack $112K and fire up the bull run. pic.twitter.com/iQ6wvyEOe8
— Michaël van de Poppe (@CryptoMichNL) September 7, 2025
Still, traders remain split over near-term direction. Cipher X suggested that failure to reclaim the $112,000–$113,000 zone could trigger fresh lows. Similarly, Crypto Tony warned,
We either flip $113,000 and pump to new highs, or if we reject here we drop to $100,000.
Key Technical Levels in Focus
Technical analysts are closely watching Bitcoin’s 50-day and 200-day simple moving averages (SMAs), currently at $115,035 and $101,760, respectively. Trader TurboBullCapital highlighted the $107,000 region as a critical support zone, cautioning that a break lower would put the $101,000 area in play, a level that also aligns with the long-term MA200.
“This is a logical area to expect a bounce,” the trader explained, suggesting that a correction to $100K would fit within Bitcoin’s broader bullish structure.
Worst-Case Scenario: A 10% Dip
Market analysts agree that a retracement to $100,000, roughly a 10% decline from current levels, represents the most likely downside scenario. Fibonacci retracement models support this view, with the 0.382 level repeatedly marking Bitcoin’s cycle lows since late 2024.
$BTC usually bottoms at the 0.382 Fibonacci level. This happened in Q3 2024, Q2 2025 and will probably happen again, trader ZYN explained.
He added that the Fibonacci retracement implies a worst-case dip to $100,000 before Bitcoin resumes its longer-term rally.
Bigger Picture Remains Bullish
Despite short-term uncertainty, many analysts remain optimistic about Bitcoin’s broader trajectory. Some believe that a retest of $100,000 could even act as a setup for a massive rally toward $150,000, driven by market squeezes and continued institutional demand.
The theory suggests that market makers may be deliberately pushing prices lower to trap short sellers before sparking a new wave of upside momentum, similar to patterns seen in late 2024.
For now, Bitcoin’s immediate challenge remains reclaiming the $112,000–$113,000 resistance zone. If bulls succeed, analysts expect fresh highs in the coming weeks. If not, a dip to $100,000 may represent the “worst-case scenario” before the next leg higher.


