


Ethereum is entering a moment of renewed strength as momentum indicators flash their first clear shift in weeks.
A new analysis from Merlijn The Trader highlights a decisive move in the Relative Strength Index (RSI), a tightening price structure above critical support, and a setup that suggests a breakout candle may be close.
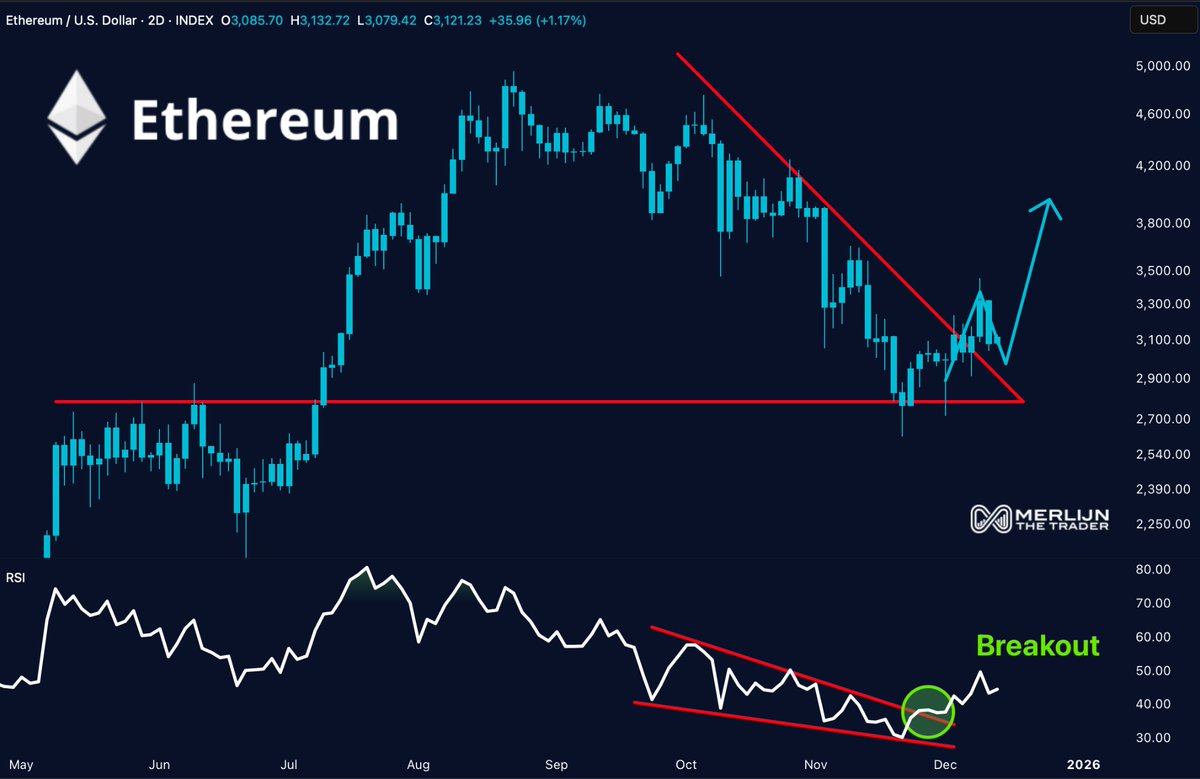
RSI Breaks Its Downtrend as Price Holds Above Support
The RSI has pierced a multi-week descending trendline, marking a shift in momentum. This type of breakout typically appears before price follows, making the signal relevant for traders assessing early trend reversals.
Price action is also coiling above a major support band around $3,000–$3,100. Holding this zone is essential. As long as Ethereum stays above $3.1K, the analysis suggests a move toward $3.4K becomes likely. This aligns with the narrowing triangle formation visible on the two-day chart, where price continues to grind higher after rejecting the lower boundary earlier this month.
Break Above $3.4K Would Open the Door to Higher Levels
The chart outlines a clear inflection point:
- Hold $3.1K → Move toward $3.4K
- Break $3.4K → Ethereum enters “open sky”
This term reflects an area of reduced overhead resistance, where price has historically accelerated. If buyers push through the $3.4K ceiling, the next significant liquidity zones sit much higher, potentially allowing Ethereum to regain levels seen earlier in the cycle.
The RSI breakout adds weight to this scenario. The indicator not only broke its downtrend but also did so with a clean retest, often a precursor to sustained strength.
Chart Structure Points Toward Rebound Potential
The chart shows Ethereum forming a base near $2.8K before reversing sharply and reclaiming short-term resistance. The descending trendline from the September high has now been breached, a structural development that typically ends a corrective phase.
Volume also stabilized during the decline and has begun to pick up during upward moves—another early tell that buyers are gaining control.
The blue projection arrow on the chart reflects a possible path toward $3.8K if the breakout holds. While not guaranteed, the pattern mirrors previous recovery setups where Ethereum used a rounded base to regain trend momentum.
Conclusion: Breakout Candle Could Be Close
Ethereum is showing multiple aligned signals:
- Momentum shift on RSI.
- Price compression above key support.
- Breakout of the major descending trendline.
As long as Ethereum holds above the $3.1K support zone, the path toward $3.4K remains intact. A confirmed break above that level would place Ethereum into a low-resistance zone where the market tends to move quickly.
According to the analysis, the breakout candle is near, and the next few sessions may determine whether Ethereum extends its recovery phase into a full trend reversal.


