


U.S. consumer inflation continued to ease in November 2025, reinforcing the picture of gradually slowing price pressures across the economy.
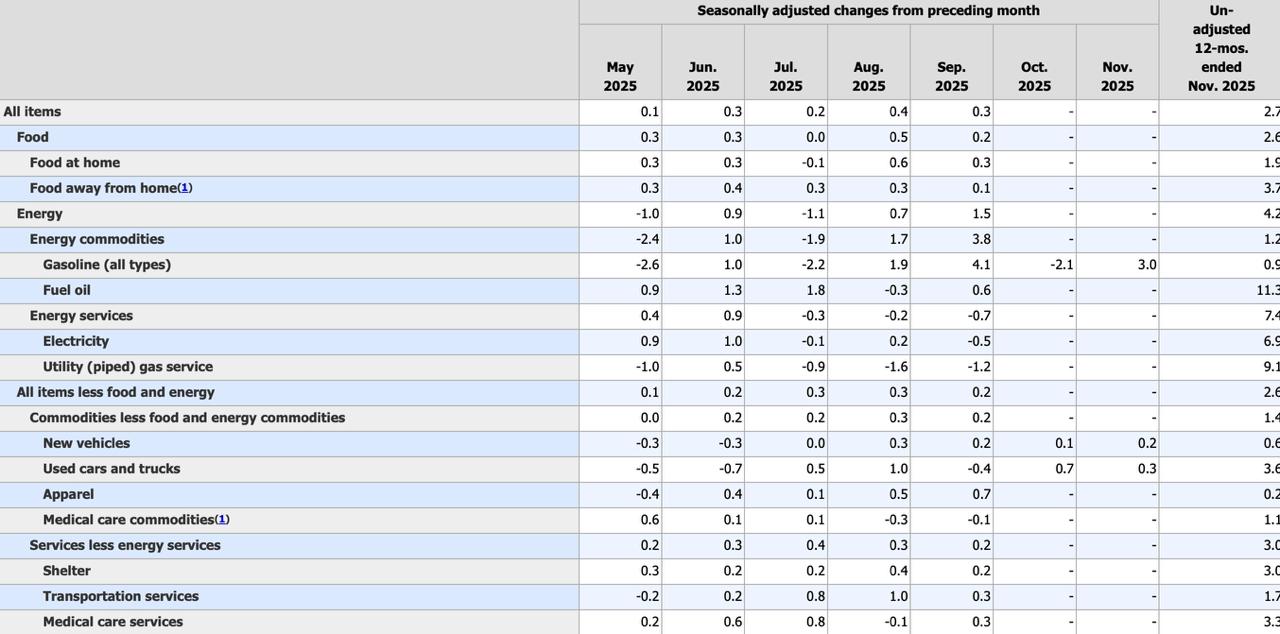
According to the U.S. Bureau of Labor Statistics, the Consumer Price Index for All Urban Consumers (CPI-U) increased 0.2% on a seasonally adjusted basis over the two-month period from September to November, while the annual inflation rate slowed to 2.7%.
The latest reading marks a decline from the 3.0% year-over-year increase reported for September and comes amid data collection disruptions caused by the federal government shutdown in October. The BLS confirmed that no survey data were collected for October and that missing data could not be retroactively recovered, though CPI data collection resumed on November 14.
Core inflation remains stable
Excluding food and energy, core CPI also rose 0.2% over the two-month period ending in November. On a 12-month basis, the core index increased 2.6%, signaling continued moderation in underlying inflation trends.
Shelter costs, which remain one of the most persistent inflation components, increased 0.2% over the same two-month period and are up 3.0% year over year. Services inflation excluding energy rose 3.0% annually, reflecting ongoing price pressures in labor-intensive categories.
Energy prices drive renewed pressure
Energy prices were a notable source of upward pressure in the latest report. The energy index increased 1.1% over the two-month period and is up 4.2% compared with a year earlier.
Within energy, gasoline prices rose 0.9% over the past 12 months, while fuel oil surged 11.3%. Electricity prices increased 6.9% year over year, and natural gas prices climbed 9.1%, highlighting persistent volatility across household energy costs.
Food inflation shows mixed trends
Food prices rose 2.6% over the past year, matching the pace of core inflation. Food at home increased 1.9%, while food away from home rose a faster 3.7%, underscoring continued cost pressures for dining services.
Within grocery categories, meats, poultry, fish, and eggs increased 4.7% year over year, while nonalcoholic beverages rose 4.3%. In contrast, dairy and related products declined 1.6% over the same period, providing some offset to higher food costs elsewhere.
Goods and services diverge
Price movements across goods categories remained uneven. New vehicle prices increased just 0.6% year over year, while used cars and trucks rose 3.6%. Apparel prices were nearly flat on an annual basis, up only 0.2%.
On the services side, medical care services rose 3.3% year over year, and transportation services increased 1.7%. Household furnishings and operations posted a notable 4.6% annual increase, reflecting continued price pressure in durable and semi-durable goods tied to housing.
Headline measures and revisions ahead
On a not seasonally adjusted basis, CPI-U reached an index level of 324.122, up 2.7% year over year. CPI-W, which tracks urban wage earners and clerical workers, also increased 2.7%. The chained CPI rose 2.6%, though BLS noted that the most recent 10 to 12 months of data remain subject to revision.
The BLS also announced a methodological change effective with this release, removing long-term care insurance from the health insurance index due to structural changes in that market.
The next CPI report, covering December 2025, is scheduled for release on January 13, 2026.


