


Bitcoin has cleared $72,500 on March 13, posting approximately 4% in daily gains and completing a full recovery from the March 9 low of $65,900 that marked the most severe point of the recent correction.
The move is drawing renewed attention not just for its size but for the technical structure that cr GainMuse argues has now transitioned from corrective to directional, with buyers controlling the broader bias for the first time since the February highs.
BTC trades at $72,612 at the time of writing, up from lows near $69,500 seen earlier in the week. The two-hour chart tells the full story of the recovery arc: a sharp drop from approximately $67,500 on March 1 down to $65,900 on March 9, followed by a steady grind higher through March 10 and 11, a brief consolidation between $69,500 and $71,000 on March 12, and then a decisive acceleration on March 13 that pushed price through $72,000 and into the $72,500 to $73,800 range visible in the session’s peak.
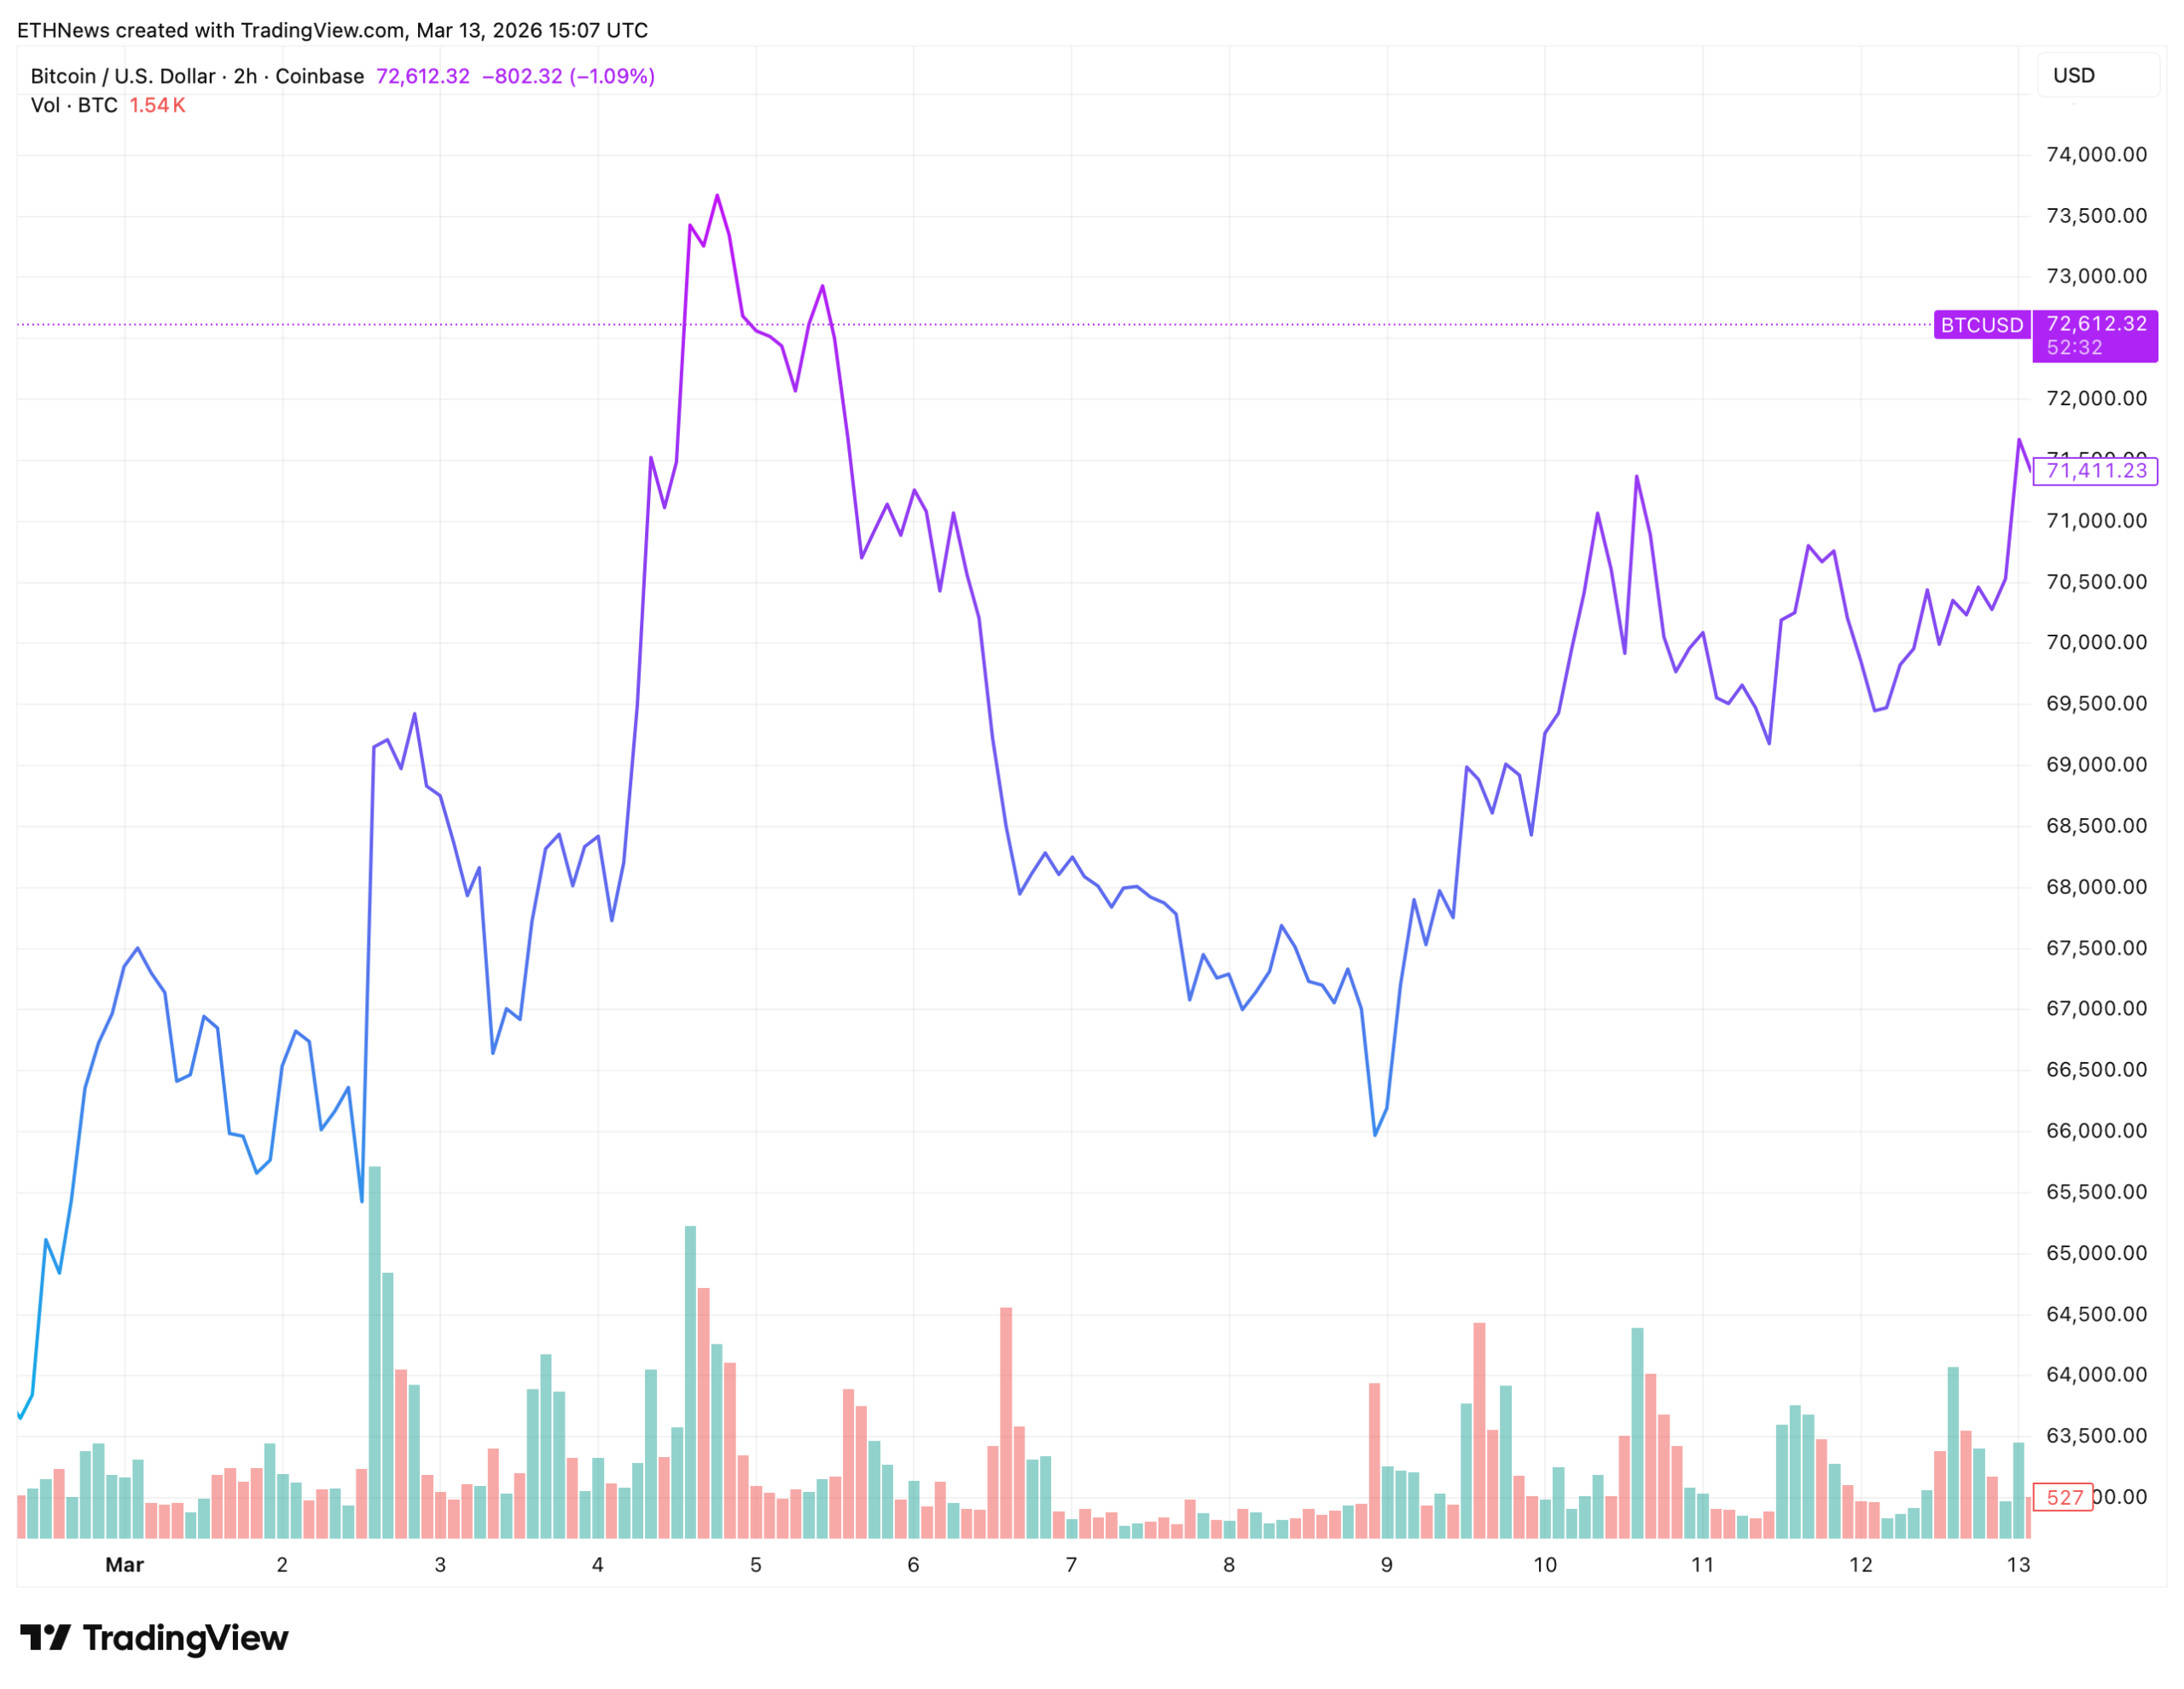
Volume has been consistently higher on the buy side throughout the recovery, with the most recent candles registering 1.54K BTC, one of the stronger readings in the two-week observable window. The recovery from $65,900 to $72,612 represents a gain of approximately 10.2% in four days, a pace that reflects genuine demand absorption rather than slow mean reversion.
Transition From Correction to Recovery
Crypto trader GainMuse published a macro chart analysis of BTC/USDT that identifies the current price action as a structural transition rather than a temporary bounce. The chart annotates a local descending channel that captured the corrective phase from the February highs, a triangle pattern that formed as selling pressure exhausted itself near the $65,900 low, and a compression zone in which price has been building since the recovery began. GainMuse’s key observation is that Bitcoin has transitioned from a corrective wedge decline into a steady recovery phase while respecting a rising support trajectory, and that the latest consolidation break indicates buyers are now controlling the broader directional bias.
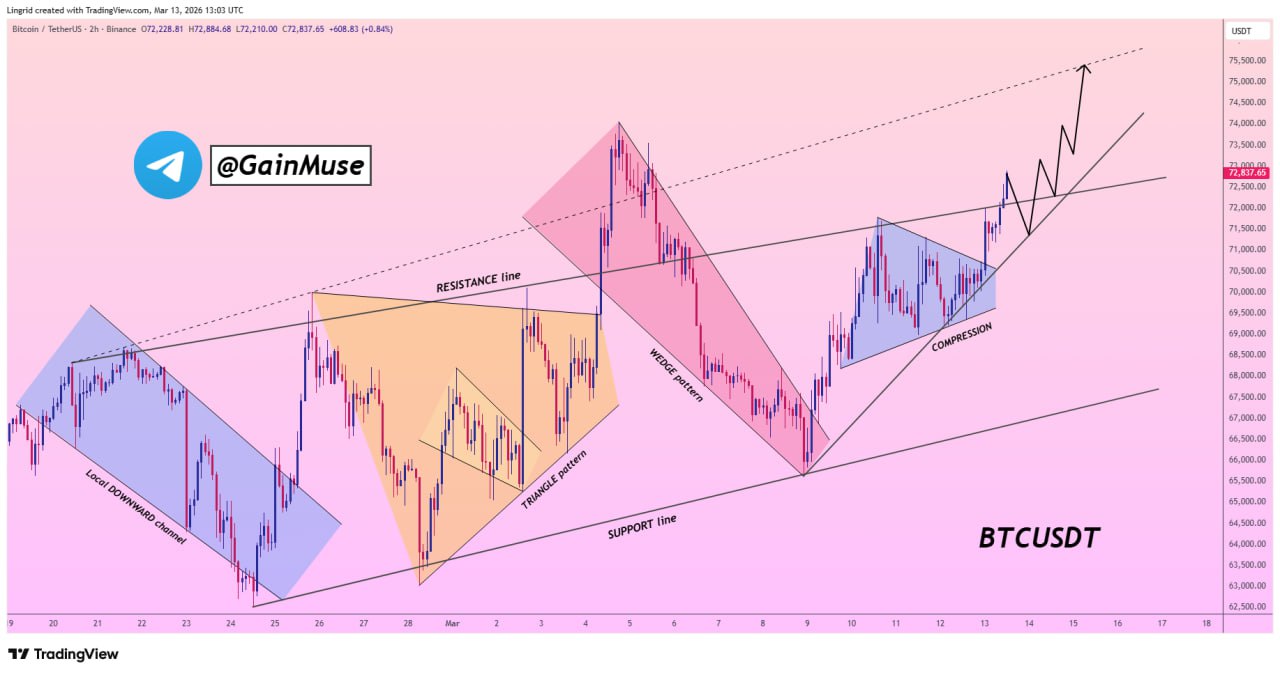
The compression zone GainMuse identifies sits just below the current price, and the analyst argues that the break above its ceiling is the structural signal that changes the picture from recovery to potential expansion. A decisive move above the compression ceiling, which appears to sit in the $72,000 to $73,000 range based on the chart geometry, opens the door for continuation toward the upper projected channel path, a trajectory that points considerably higher on GainMuse’s timeframe. The analyst places a specific risk condition on the bullish scenario: failure to sustain momentum above the trend support might trigger a temporary pullback toward the previous structural demand area, which on the two-hour chart corresponds to the $69,500 to $70,000 zone that provided support through most of March 12.
The Macro Context Behind the Move
Today’s Bitcoin advance is arriving alongside a specific macroeconomic backdrop that is amplifying the move beyond what chart structure alone would explain. U.S. fourth quarter 2025 GDP was revised down to 0.7% annualized growth, a sharp cut from the initial 1.4% estimate, while Core PCE inflation remained at 3.1% annually, above the Federal Reserve’s 2% target. The combination of slowing growth and persistent inflation has strengthened Bitcoin’s narrative as a hard money asset during stagflationary conditions, with capital rotating into BTC even as the U.S. dollar remains firm. A positive flip in the Coinbase Premium confirmed that U.S. institutional buyers were active in the afternoon session, a reading supported by the ETF flow data showing BlackRock and Fidelity purchasing a combined $61.40 million in BTC through their ETF products on the same day.
The 50-day simple moving average at $72,748, identified in yesterday’s market data, sits just above current price and represents the immediate technical ceiling bulls need to clear to confirm the recovery has entered a new phase. Bitcoin has approached but not yet closed a daily candle above that level. GainMuse’s compression ceiling and the 50-day SMA are converging in the same price zone, which means the $72,748 to $73,000 range carries a double layer of significance on today’s timeframe.
The Two Outcomes Defined
GainMuse’s framework produces two clean scenarios from here. A daily close above the compression ceiling with volume comparable to today’s session opens the path toward the upper projected channel, which on the analyst’s macro chart points toward the $75,000 to $78,000 range depending on timing. The $70,000 level, which has now been defended on multiple tests and represents the floor of the current consolidation range, is the line bulls must protect on any pullback to keep the recovery structure intact.
A failure to hold $70,000 on the next test reopens the move toward $68,000 and eventually back toward the structural demand area near $65,900. That level, as GainMuse’s chart and the two-week price action both confirm, is where buyers demonstrated their maximum conviction during the correction. Whether they need to return to defend it again, or whether today’s break above $72,500 marks the point at which the corrective phase is definitively behind the market, is the question the next several sessions will answer.


