


Bitcoin has reached its weakest level against Gold in the past two years, according to a chart shared by Michaël van de Poppe.
The BTC/Gold ratio now sits at a level that historically coincided with major market bottoms, placing the pair at a critical inflection point.
The move highlights how sharply Bitcoin has underperformed Gold recently, even as Gold continues to rise. However, the positioning of momentum indicators on multiple timeframes suggests this imbalance may be approaching exhaustion.
Weekly RSI Drops to Levels Seen at Major Bitcoin Bottoms
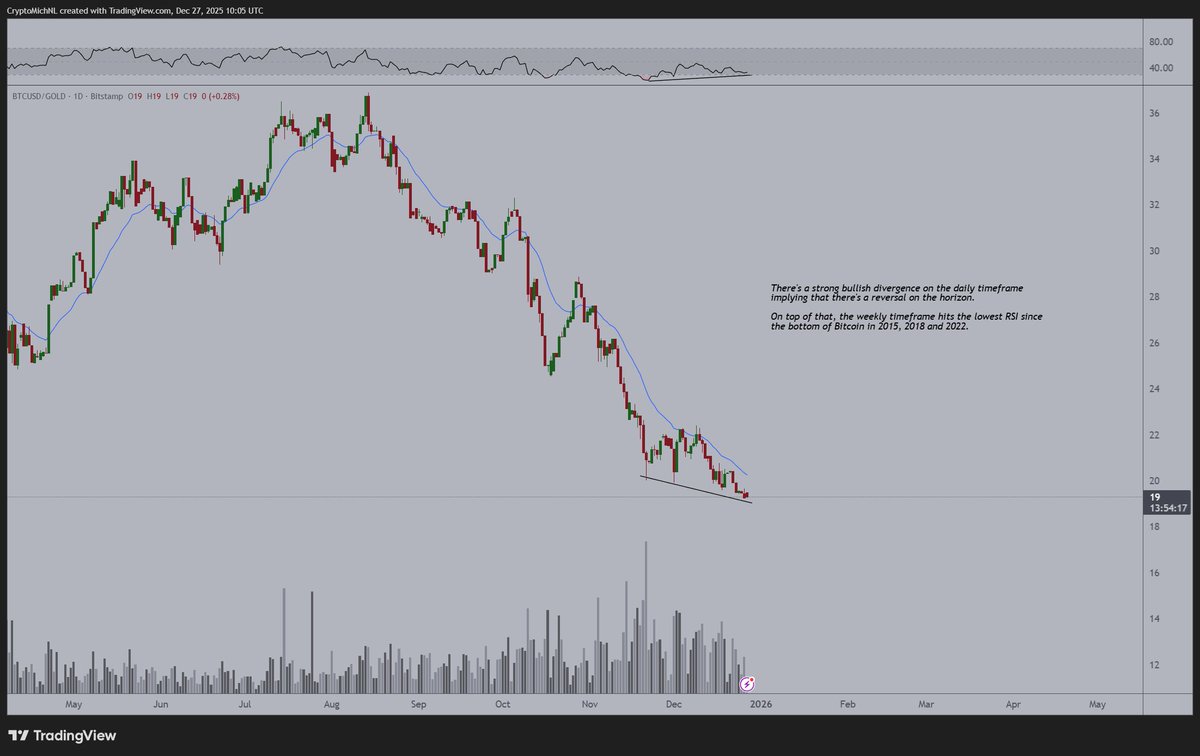
On the weekly timeframe, the Relative Strength Index has fallen to its lowest reading since the major Bitcoin bottoms of 2015, 2018, and 2022. Each of those periods marked long-term turning points where downside momentum against Gold was nearing completion.
This extreme RSI compression reflects sustained relative weakness, but also places the BTC/Gold pair deep into historically oversold territory on a longer-term basis.
Daily Bullish Divergence Signals Potential Shift
While the weekly chart highlights exhaustion, the daily timeframe adds another layer to the setup. A bullish divergence remains intact, indicating that downside momentum is weakening even as price continues to trend lower.
This divergence suggests that selling pressure against Gold may be fading, opening the door for a potential reversal on the BTC/Gold chart despite Gold’s recent strength.
Relative Performance Thesis, Not a Short-Term Explosion
The setup does not imply an immediate surge or “moon” scenario for Bitcoin. Instead, it points toward relative performance. The structure suggests a scenario where Bitcoin begins to outperform Gold, even if absolute price action remains measured.
Given Bitcoin’s higher volatility profile, the core thesis presented is that Bitcoin rises while Gold enters a consolidation phase, allowing the ratio to recover from historically depressed levels.
Volatility Defines the Path Forward
Bitcoin’s higher volatility compared to Gold remains a defining factor in this relationship. The chart structure supports a gradual shift rather than an instant breakout, with relative strength likely rebuilding over time if historical patterns repeat.
For now, the BTC/Gold ratio sits at an extreme that has previously preceded meaningful reversals, making this level a key zone to watch going forward.


