


- Bitcoin ETF outflows topped $1.5B since May 7, while spot and futures CVD show sellers still control market orders.
- On-chain data shows older BTC holders moved coins to exchanges, while short-term holders sold near losses below SOPR’s 1.0 level.
Bitcoin’s latest decline is drawing fresh caution from market analysts as ETF flows, derivatives data, and on-chain activity show pressure beyond a normal pullback.
BTC has fallen from about $82,000 to nearly $76,800 within days, erasing roughly 6% after its earlier rally from the $60,000 area. While such a move can appear routine after a sharp advance, current market data shows heavier selling across several key areas.
U.S.-listed spot Bitcoin ETFs have recorded more than $1.5 billion in outflows since May 7, according to SoSoValue data. Monday’s withdrawals reached $648 million, marking the largest single-day outflow since Jan. 29. Investors also removed $635 million from the same products last Tuesday.
Those redemptions have erased early-month inflows and pushed total net flows since May 1 into negative territory. For Bitcoin, that shift matters as spot ETFs now serve as one of the clearest gauges of institutional demand. Sustained withdrawals suggest larger investors are reducing exposure rather than treating the decline as a quick buying opportunity.
Market-order data also shows that sellers are taking control. Cumulative Volume Delta, which tracks whether market buys or sells drive price action, has turned sharply negative across both spot and futures markets.
Glassnode data shows aggregate spot CVD across major exchanges moved from $16.9 million to negative $126.2 million during the selloff. The futures market shows an even deeper move, with perpetual futures CVD falling to negative $368.5 million.
On-chain Selling Adds Pressure to Bitcoin
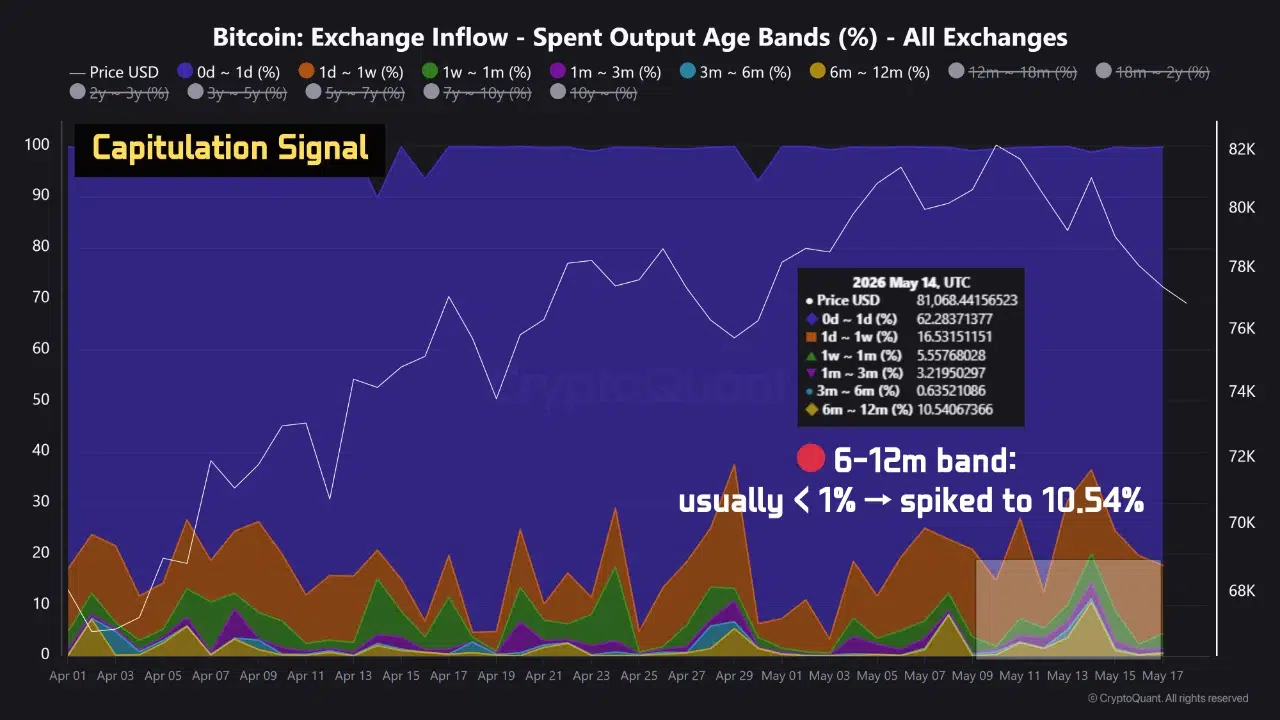
On-chain data also points to stress among holders who bought Bitcoin between 6 and 12 months ago. Easy On Chain noted that this group carries an average realized entry price near $110,851, placing many holders in deep unrealized losses after the recent decline.
Since May 14, exchange inflows from these long-term holders have increased. The SOAB ratio for coins aged 6 to 12 months reportedly climbed to 10.54%, far above its usual level below 1%. Such a jump shows that older coins are moving toward exchanges at an unusual pace.
Short-term holder data also shows weaker sentiment. On May 16, STH-SOPR fell to 0.994, while aSOPR dropped to 0.996. Both readings sit below the key 1.0 level, which means many coins are moving at a loss rather than a profit.
Even on May 17, STH-SOPR stayed weak at 0.999. That reading suggests short-term exchange inflows still reflect fear-driven selling, not normal profit-taking.
Options traders are also paying more for downside protection. Glassnode data shows Bitcoin’s options delta skew rose from 10.9% to 14.4%, meaning put options became more expensive than calls. Puts help traders protect against price losses, so rising demand points to caution among derivatives participants.
Analysts are watching the $76,000 area as Bitcoin’s first support zone. A wider demand region sits between $74,000 and $75,000. A clean break below that range could extend the correction.
The $80,127 level also remains important, as it marks the average entry price for holders who bought within one day to one week. Until Bitcoin reclaims that area and selling pressure cools, on-chain data suggests the current drop remains risky for aggressive dip-buying.
However, some analysts have pointed to a slowdown in selling pressure as Bitcoin exchange balances continue to fall.


