


A recent GainMuse analysis highlights how Ethereum’s price action becomes far clearer once market structure replaces raw price observation.
The comparison between a standard price chart and a structured overlay shows that what many traders perceive as randomness is often an orderly sequence of channels, consolidations, and breakdowns.
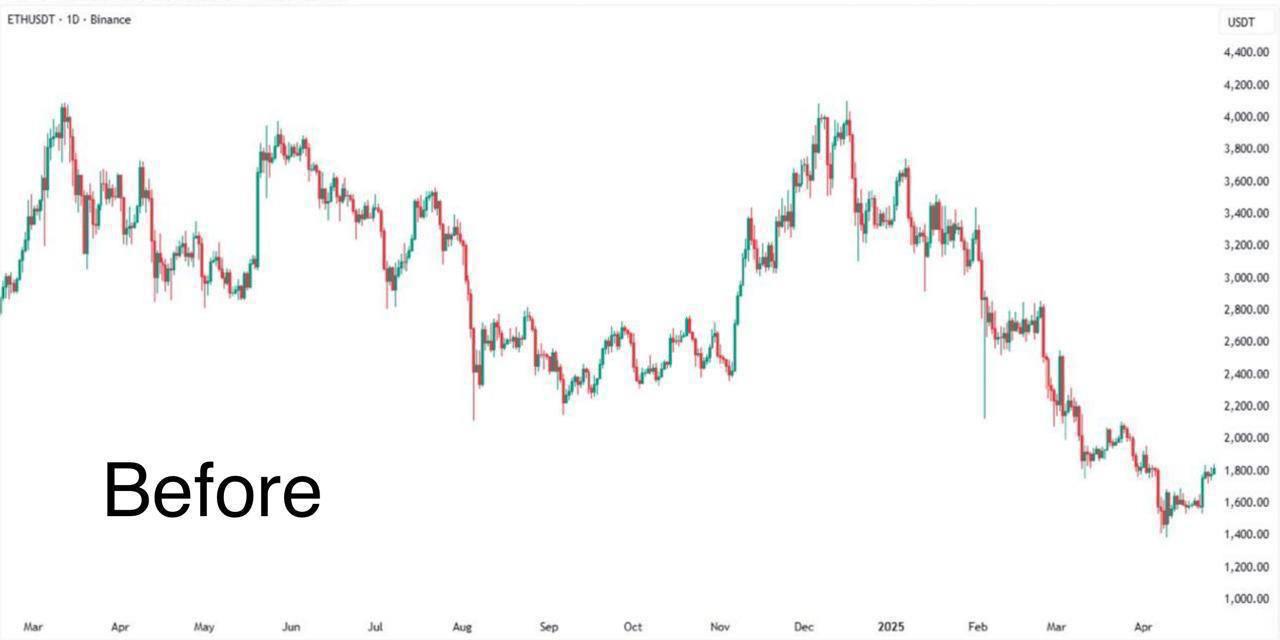
The “before” view presents Ethereum’s movement as choppy and difficult to trade, especially during extended declines. Without contextual tools, price swings appear emotional and unpredictable, leading many participants to rely on guessing direction rather than managing risk.
The “after” view tells a different story. By applying structure, the same price data reveals consistent behavior that repeats over time.
Channels and Ranges Defined the Entire Move
According to the GainMuse chart, Ethereum spent much of the period moving inside clearly defined descending channels. Each rebound stalled near channel resistance, while breakdowns below support accelerated downside continuation. These were not isolated events but repeated reactions to the same structural boundaries.
The analysis also highlights multiple consolidation zones that formed before major directional moves. Price compressed inside tight ranges before releasing liquidity, suggesting that volatility expansions followed preparation phases rather than sudden shocks.
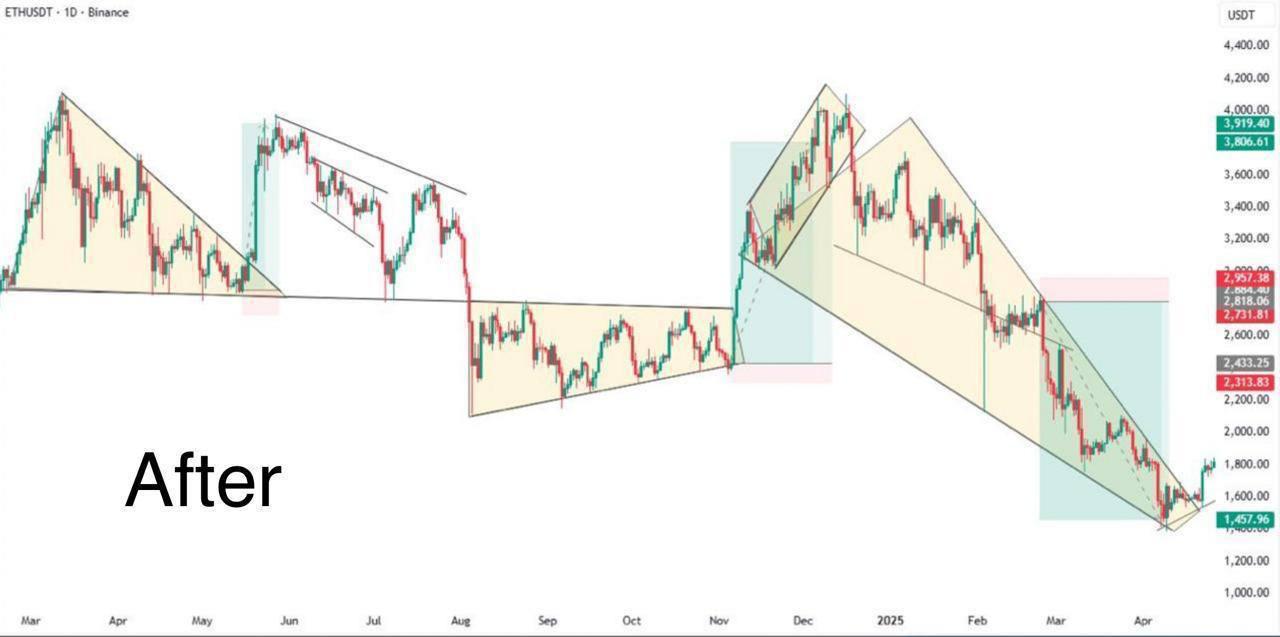
What initially looks like chaos becomes a sequence of readable transitions once structure is applied.
Structure Over Prediction
GainMuse’s core message is not about predicting future prices. Instead, the analysis focuses on identifying where price has already revealed intent through structure. Rather than forecasting tops or bottoms, the framework emphasizes understanding where risk is defined and where continuation is statistically favored.
The chart demonstrates that profitable opportunities came from reacting to confirmed breakdowns and channel respect, not from anticipating reversals based on hope or opinion.
This approach shifts trading away from emotional decision-making and toward execution based on observable behavior.
Data-Driven Insight, Not Guesswork
The accompanying commentary stresses that the goal is not to guess market direction but to follow where informed capital is already moving. By combining price structure with professional on-chain and derivatives analytics, traders can observe how liquidity is being absorbed and redistributed.
The emphasis is on precision analytics rather than narrative-based predictions, reinforcing that consistency comes from process, not intuition.
The Takeaway From the GainMuse Chart
The comparison between the “before” and “after” charts underlines a simple conclusion from GainMuse’s analysis: Ethereum’s decline was not unpredictable. It followed identifiable structural rules that repeated across timeframes.
Traders who relied solely on price likely experienced confusion and late entries. Those who respected channels, ranges, and reaction zones had clearer signals, better-defined risk, and fewer emotional decisions.
In volatile markets, structure does not guarantee success, but it replaces guessing with discipline, and that difference is visible directly on the chart.


