


Layer-1 blockchains have faced a difficult year, with most major networks ending 2025 deep in negative territory.
Data from Castle Labs shows a broad underperformance across the sector, highlighting how uneven capital distribution has been within crypto’s base-layer ecosystems.
A Year Defined by Drawdowns Across Layer-1s
The chart tracks the relative performance of leading Layer-1 tokens throughout 2025, revealing a consistent pattern of weakness. While many assets experienced brief mid-year recoveries, those moves failed to hold into year-end.
According to the data:
- TON recorded the steepest decline, down 73.8%
- AVAX followed closely, falling 67.9%
- SUI dropped 67.3%
- SOL ended the year down 35.9%
- ETH declined 15.3%
- HYPE posted a smaller loss of 6.5%
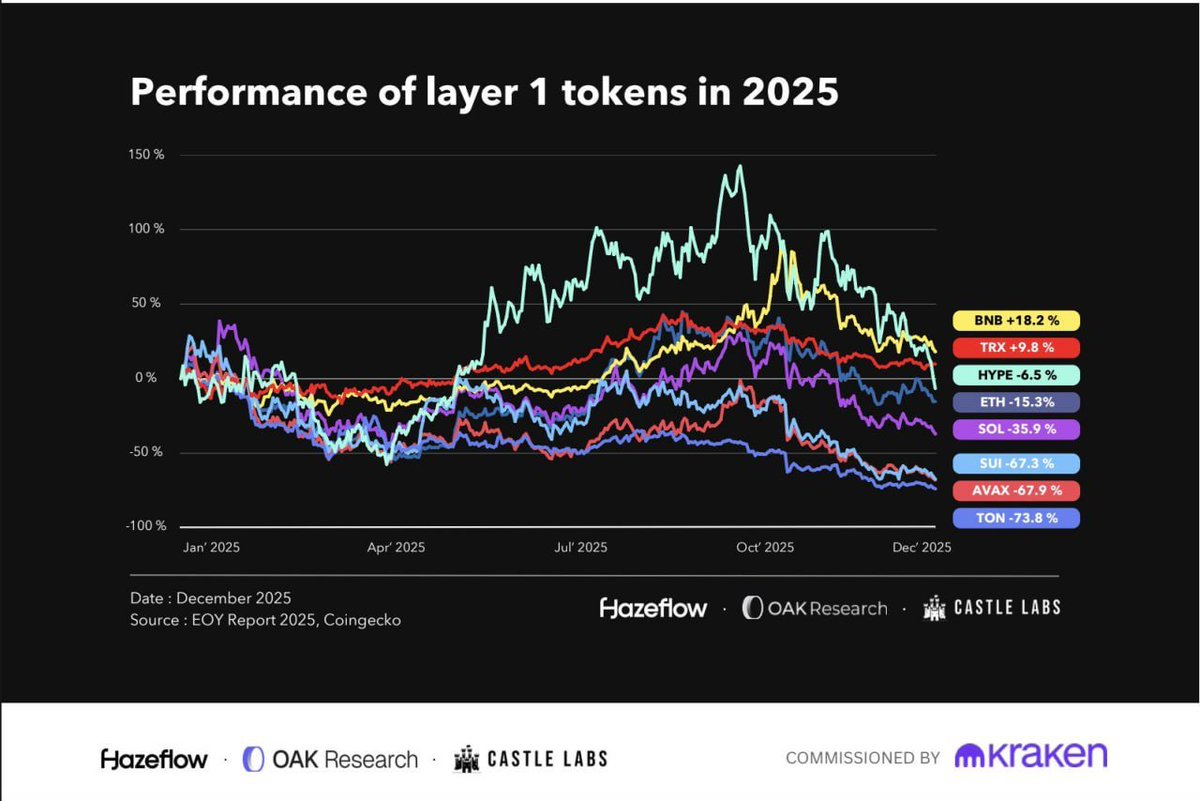
The synchronized drawdowns suggest sector-wide pressure rather than isolated project-specific issues. Even tokens that briefly outperformed during the year eventually rolled over alongside the broader group.
BNB and TRX Stand Out as Exceptions
Amid widespread losses, only two Layer-1 tokens managed to close the year with gains:
- BNB finished up 18.2%
- TRX gained 9.8%
Their relative strength stands out clearly on the chart, especially during periods when most Layer-1 assets were trending lower. While the chart does not explain the reasons behind this divergence, the performance gap underscores how selective the market has been.
Mid-Year Rallies Failed to Hold
Several Layer-1 tokens staged noticeable recoveries during the middle of the year, with performance lines briefly moving into positive territory. However, these rallies proved unsustainable. By the final months of 2025, nearly all assets had reversed sharply, pushing returns back into negative territory.
This pattern points to fading momentum rather than a sustained rotation into Layer-1 infrastructure tokens.
What the Chart Signals Going Forward
The overall picture is one of broad underperformance, not just volatility. With most Layer-1 tokens ending the year significantly lower, the data suggests investors were increasingly cautious toward base-layer exposure in 2025.
At the same time, the clear separation between winners and losers highlights a more selective market environment. Rather than lifting the entire Layer-1 sector, capital concentrated into a narrow set of networks, leaving the majority behind.
As the year closes, the chart captures a market that tested optimism but ultimately rewarded restraint, setting the stage for a more discerning approach to Layer-1 valuations moving forward.


