


A new technical setup in Zcash is drawing attention after price surged above a long-standing resistance zone, triggering renewed bullish discussion across crypto markets.
According to a chart shared by Ali Charts, ZEC is completing a structure that historically precedes sharp upside continuation, with a potential breakout move already unfolding.
The focus now shifts to whether the recent price expansion marks the confirmation phase of a larger bullish pattern or simply a short-term volatility spike. The chart structure, momentum behavior, and live price action suggest the former may be gaining traction.
Zcash $ZEC is setting up for a 35% breakout!
A close above $470 would confirm it. pic.twitter.com/X02ybZFJxy
— Ali Charts (@alicharts) December 27, 2025
Ascending Structure Signals Breakout Pressure
The 4-hour ZEC chart highlights a rising ascending triangle, defined by a series of higher lows compressing against a flat resistance near $470. This type of structure typically reflects seller absorption, where selling pressure weakens as buyers step in at progressively higher levels.
In the chart, price repeatedly tested the upper boundary before finally breaking through. Ali Charts notes that a close above $470 confirms the setup, unlocking a projected move of approximately 35%, based on the height of the triangle’s base. The measured move aligns with classical technical analysis, where volatility expansion follows prolonged consolidation.
Notably, the breakout occurred after multiple failed downside attempts, reinforcing the idea that sellers were becoming exhausted before price accelerated higher.
Momentum Expands as ZEC Clears Resistance
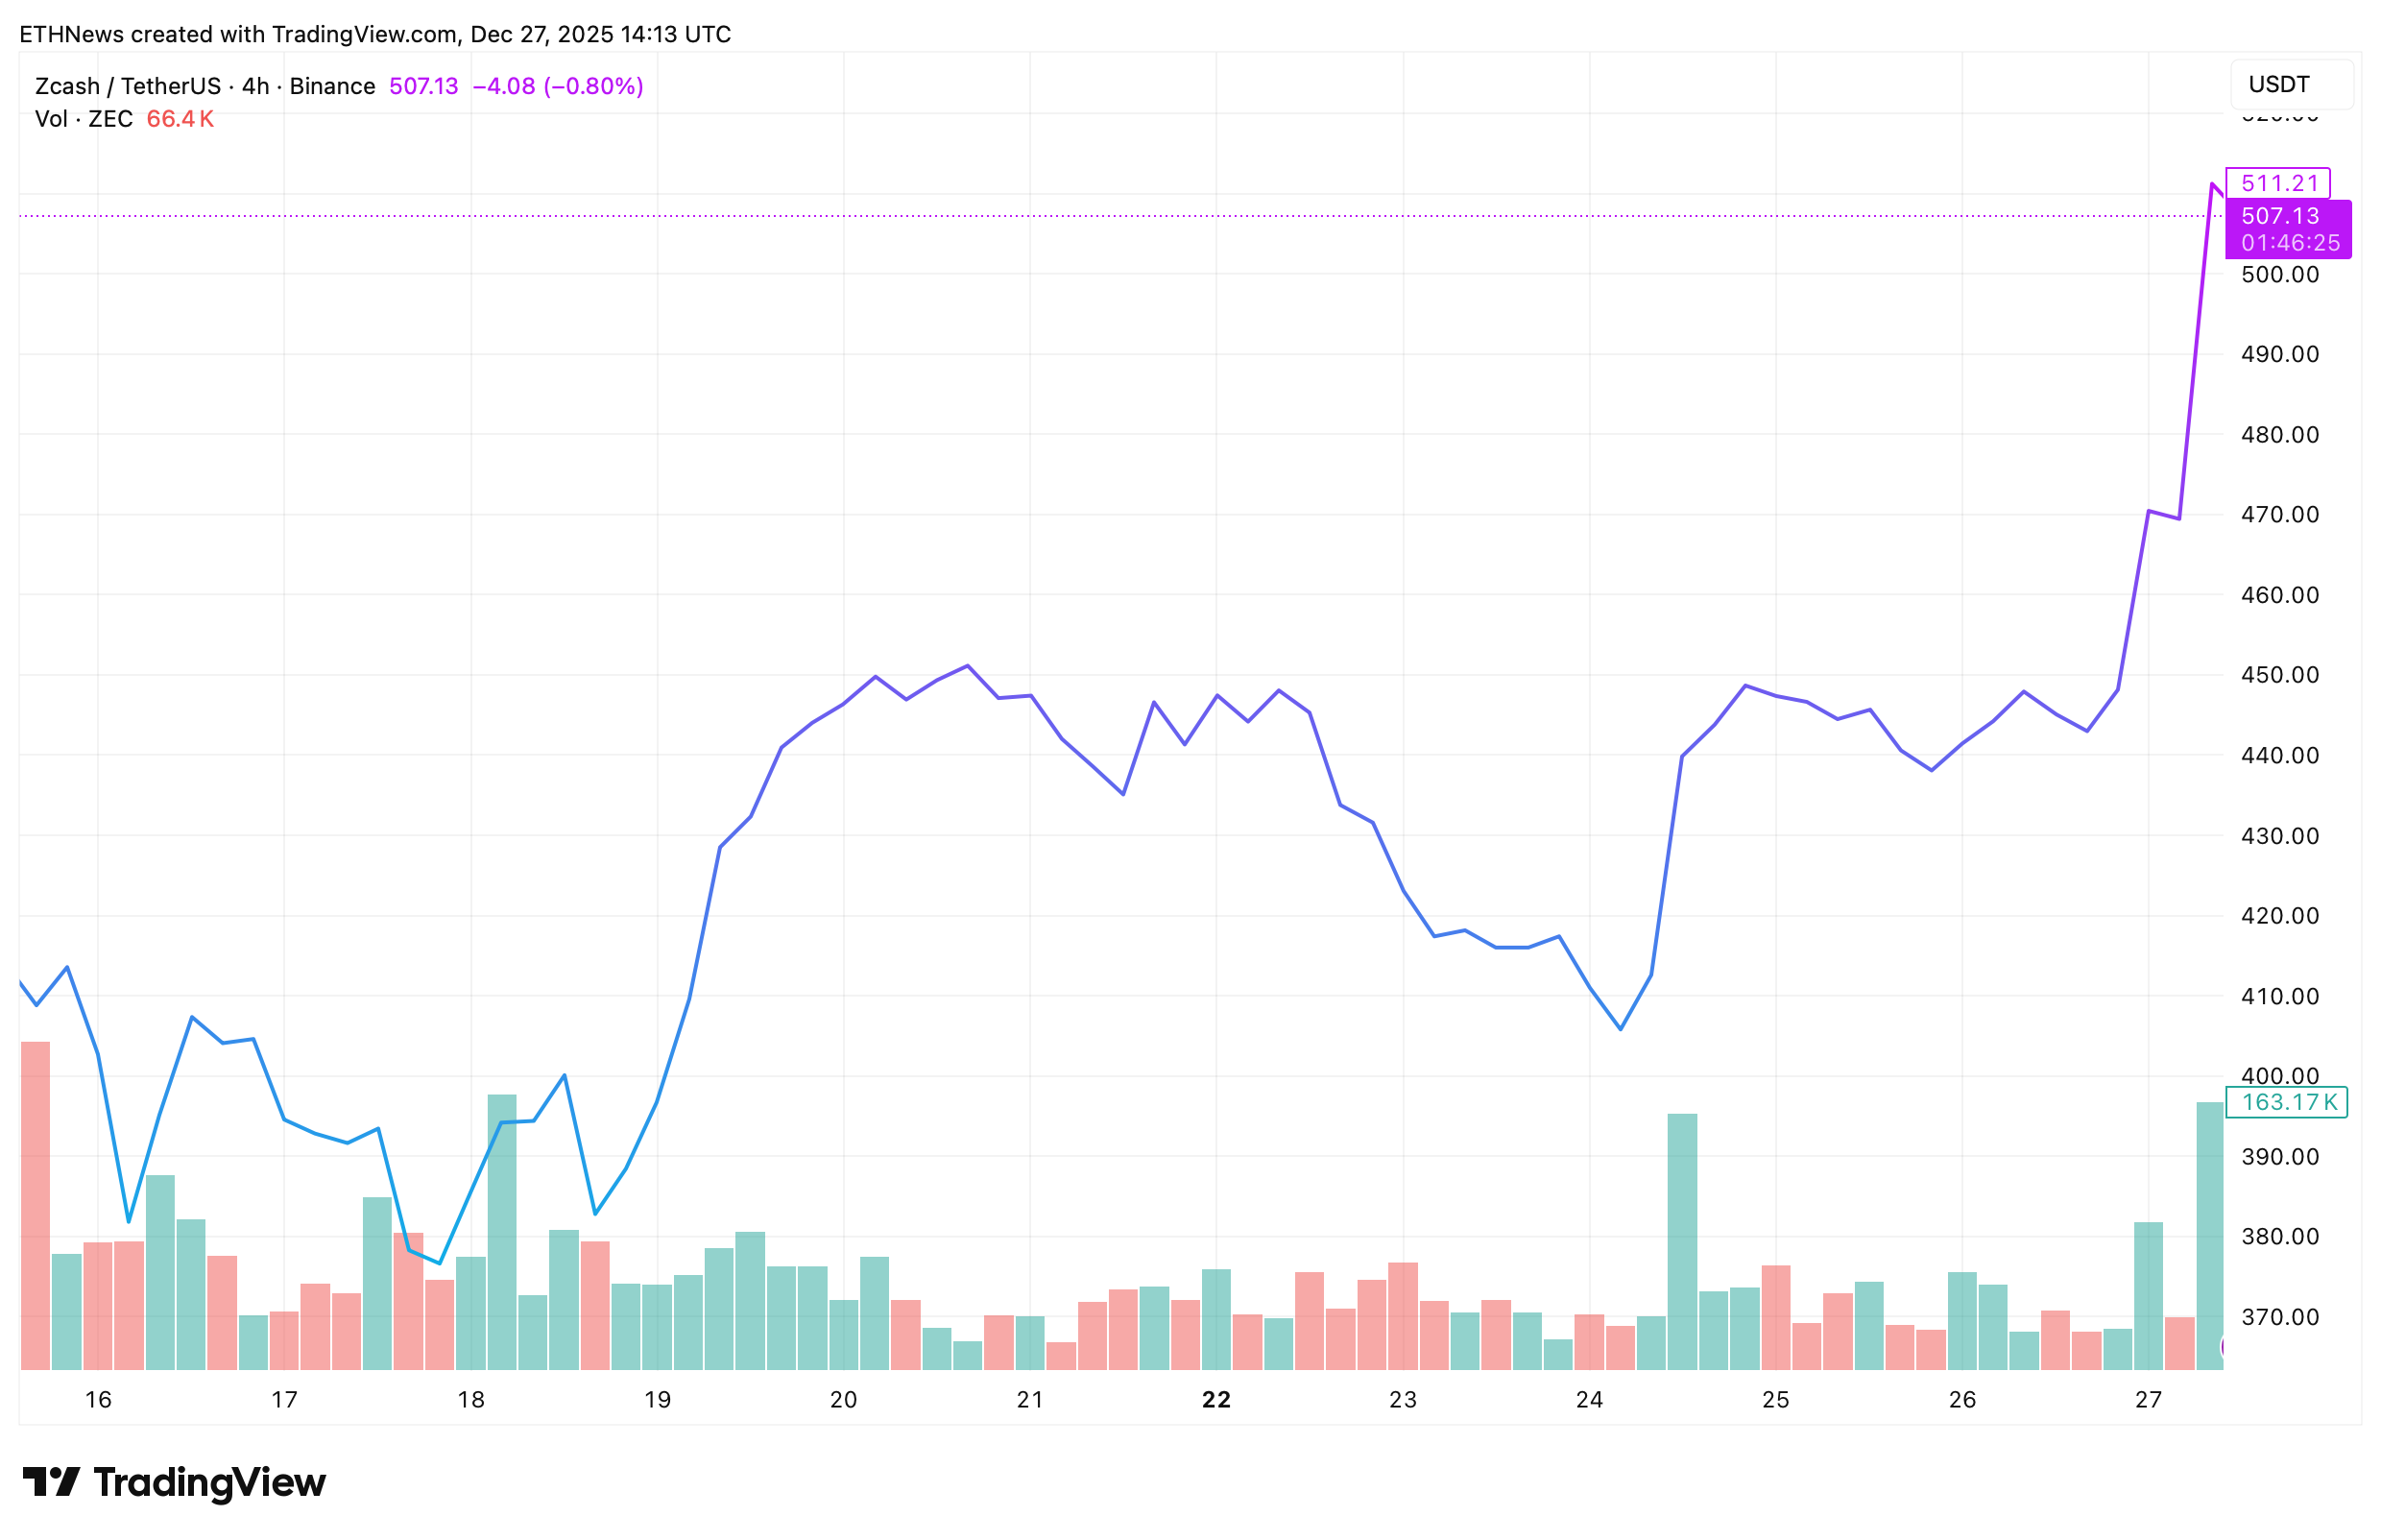
Following the breakout, Zcash price surged into the $500+ zone, with the TradingView snapshot showing ZEC trading around $507 at the time of capture. The move unfolded rapidly, accompanied by a visible increase in trading volume, signaling active participation rather than a thin liquidity spike.
The price also reclaimed its 50-day moving average near $469, flipping a former resistance into short-term structural support. Meanwhile, momentum indicators shown in the accompanying data remain constructive. The 14-day RSI sits near neutral, suggesting the rally has not yet reached overheated conditions despite the sharp advance.
This combination, breakout confirmation, volume expansion, and neutral momentum — often characterizes the early stages of a trend move, rather than its exhaustion phase.
Why the $470 Level Matters Now
The $470 zone now serves as a critical reference point. As long as ZEC holds above this level on higher-timeframe closes, the breakout structure remains intact. A successful retest would further validate the bullish thesis outlined in the chart.
Ali Charts’ original projection targets a 35% continuation move, which aligns with the broader price forecast panel shown in the images. While volatility remains elevated, the structure itself reflects controlled accumulation, not impulsive chasing.
In short, Zcash is no longer reacting inside a compression range, it is actively resolving one. Whether this move develops into a sustained trend will depend on how price behaves around former resistance turned support, but technically, the breakout signal is now on the table.


