


BNB has gained nearly 5% over the past week, stabilizing above the $880 level after a steady recovery from late-December lows. The latest chart shows BNB trading around $885, with price action gradually grinding higher rather than accelerating sharply, an important detail for assessing sustainability.
What the TradingView Chart Shows
The chart reflects a series of higher lows since December 26, signaling improving short-term structure. After an initial impulse move from the $840–$850 zone, BNB entered a consolidation phase before pushing higher again into early January. This type of stair-step advance typically suggests controlled accumulation rather than speculative spikes.
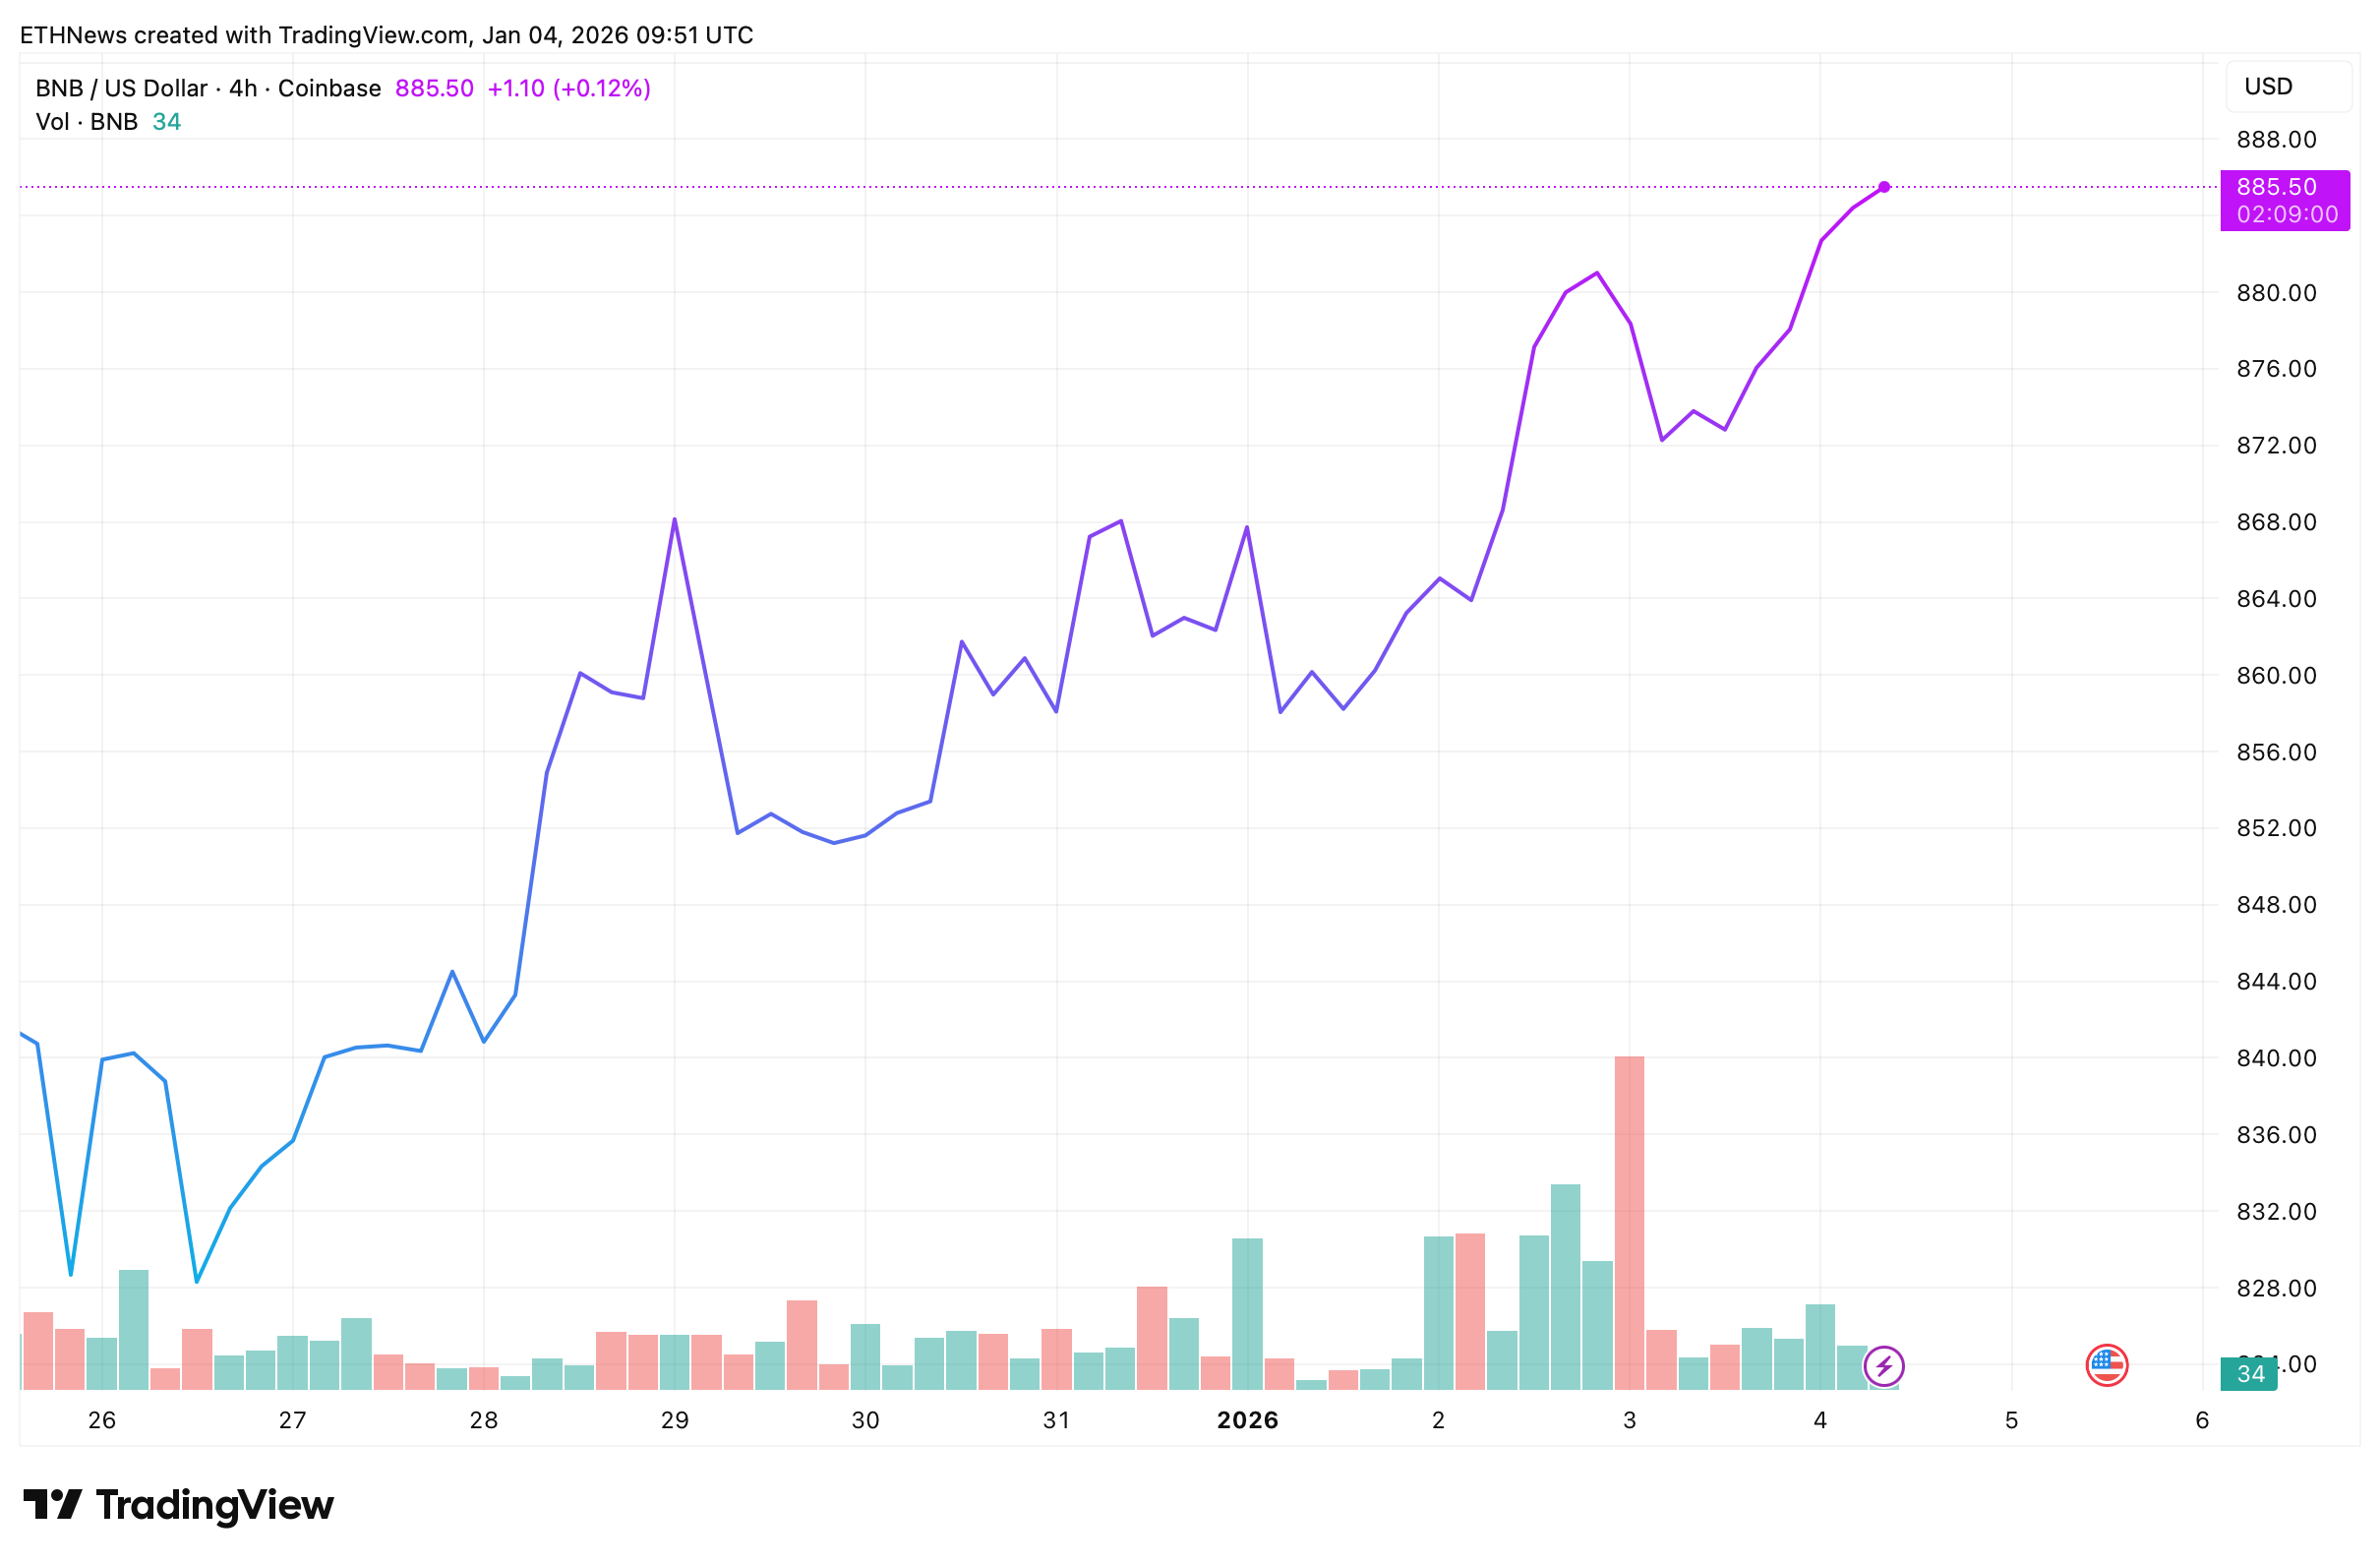
Volume confirms this behavior. Buying activity expanded during upside pushes, while pullbacks were accompanied by lighter volume, indicating limited aggressive selling pressure.
Key Technical Levels to Watch
- Immediate support: $872–$875
This area acted as a consolidation base after the most recent pullback. Holding above it keeps the short-term trend intact. - Major support: $855–$865
This zone aligns closely with both the 50-day SMA (~$864) and recent reaction lows. A break below would weaken the current structure. - Near-term resistance: $890–$900
Price is currently pressing into this range. A clean break and hold above $900 would likely invite another leg higher. - Upper resistance: $920–$940
This region capped price during previous rallies and remains a key test if upside continuation develops.
Indicators and Market Context
Momentum indicators remain neutral rather than overheated. The 14-day RSI near 54 suggests room for price movement in either direction, while volatility remains moderate. Notably, BNB is trading above both its 50-day and 200-day SMAs, reinforcing a structurally constructive setup despite broader market caution.
Sentiment readings still lean defensive, with extreme fear present across the crypto market. Historically, this environment often favors gradual upside as sellers thin out before confidence returns.
Probabilities Going Forward
- Base case: Sideways-to-higher consolidation between $875 and $900, building pressure for a breakout.
- Bullish scenario: Sustained acceptance above $900 opens the path toward $920–$940.
- Bearish risk: Loss of $865 would shift focus back toward $840 support, invalidating the current higher-low structure.
For now, BNB’s price action reflects stability rather than excess. As long as support zones continue to hold, the market appears positioned for continuation rather than reversal.


