


Cardano (ADA) is showing early signs of a potential short-term reversal after a volatile trading session, with technical charts and analyst commentary pointing to a possible shift in momentum.
Price action remains unstable, but emerging candlestick structures suggest sellers may be losing control.
ADA Price Stabilizes After Sharp Intraday Drop
On the 1-hour ADA/USDT chart, Cardano is trading near $0.347, following a sudden sell-off that briefly pushed price below the $0.345 level. The move was sharp but short-lived, as buyers quickly stepped in and forced a rebound.
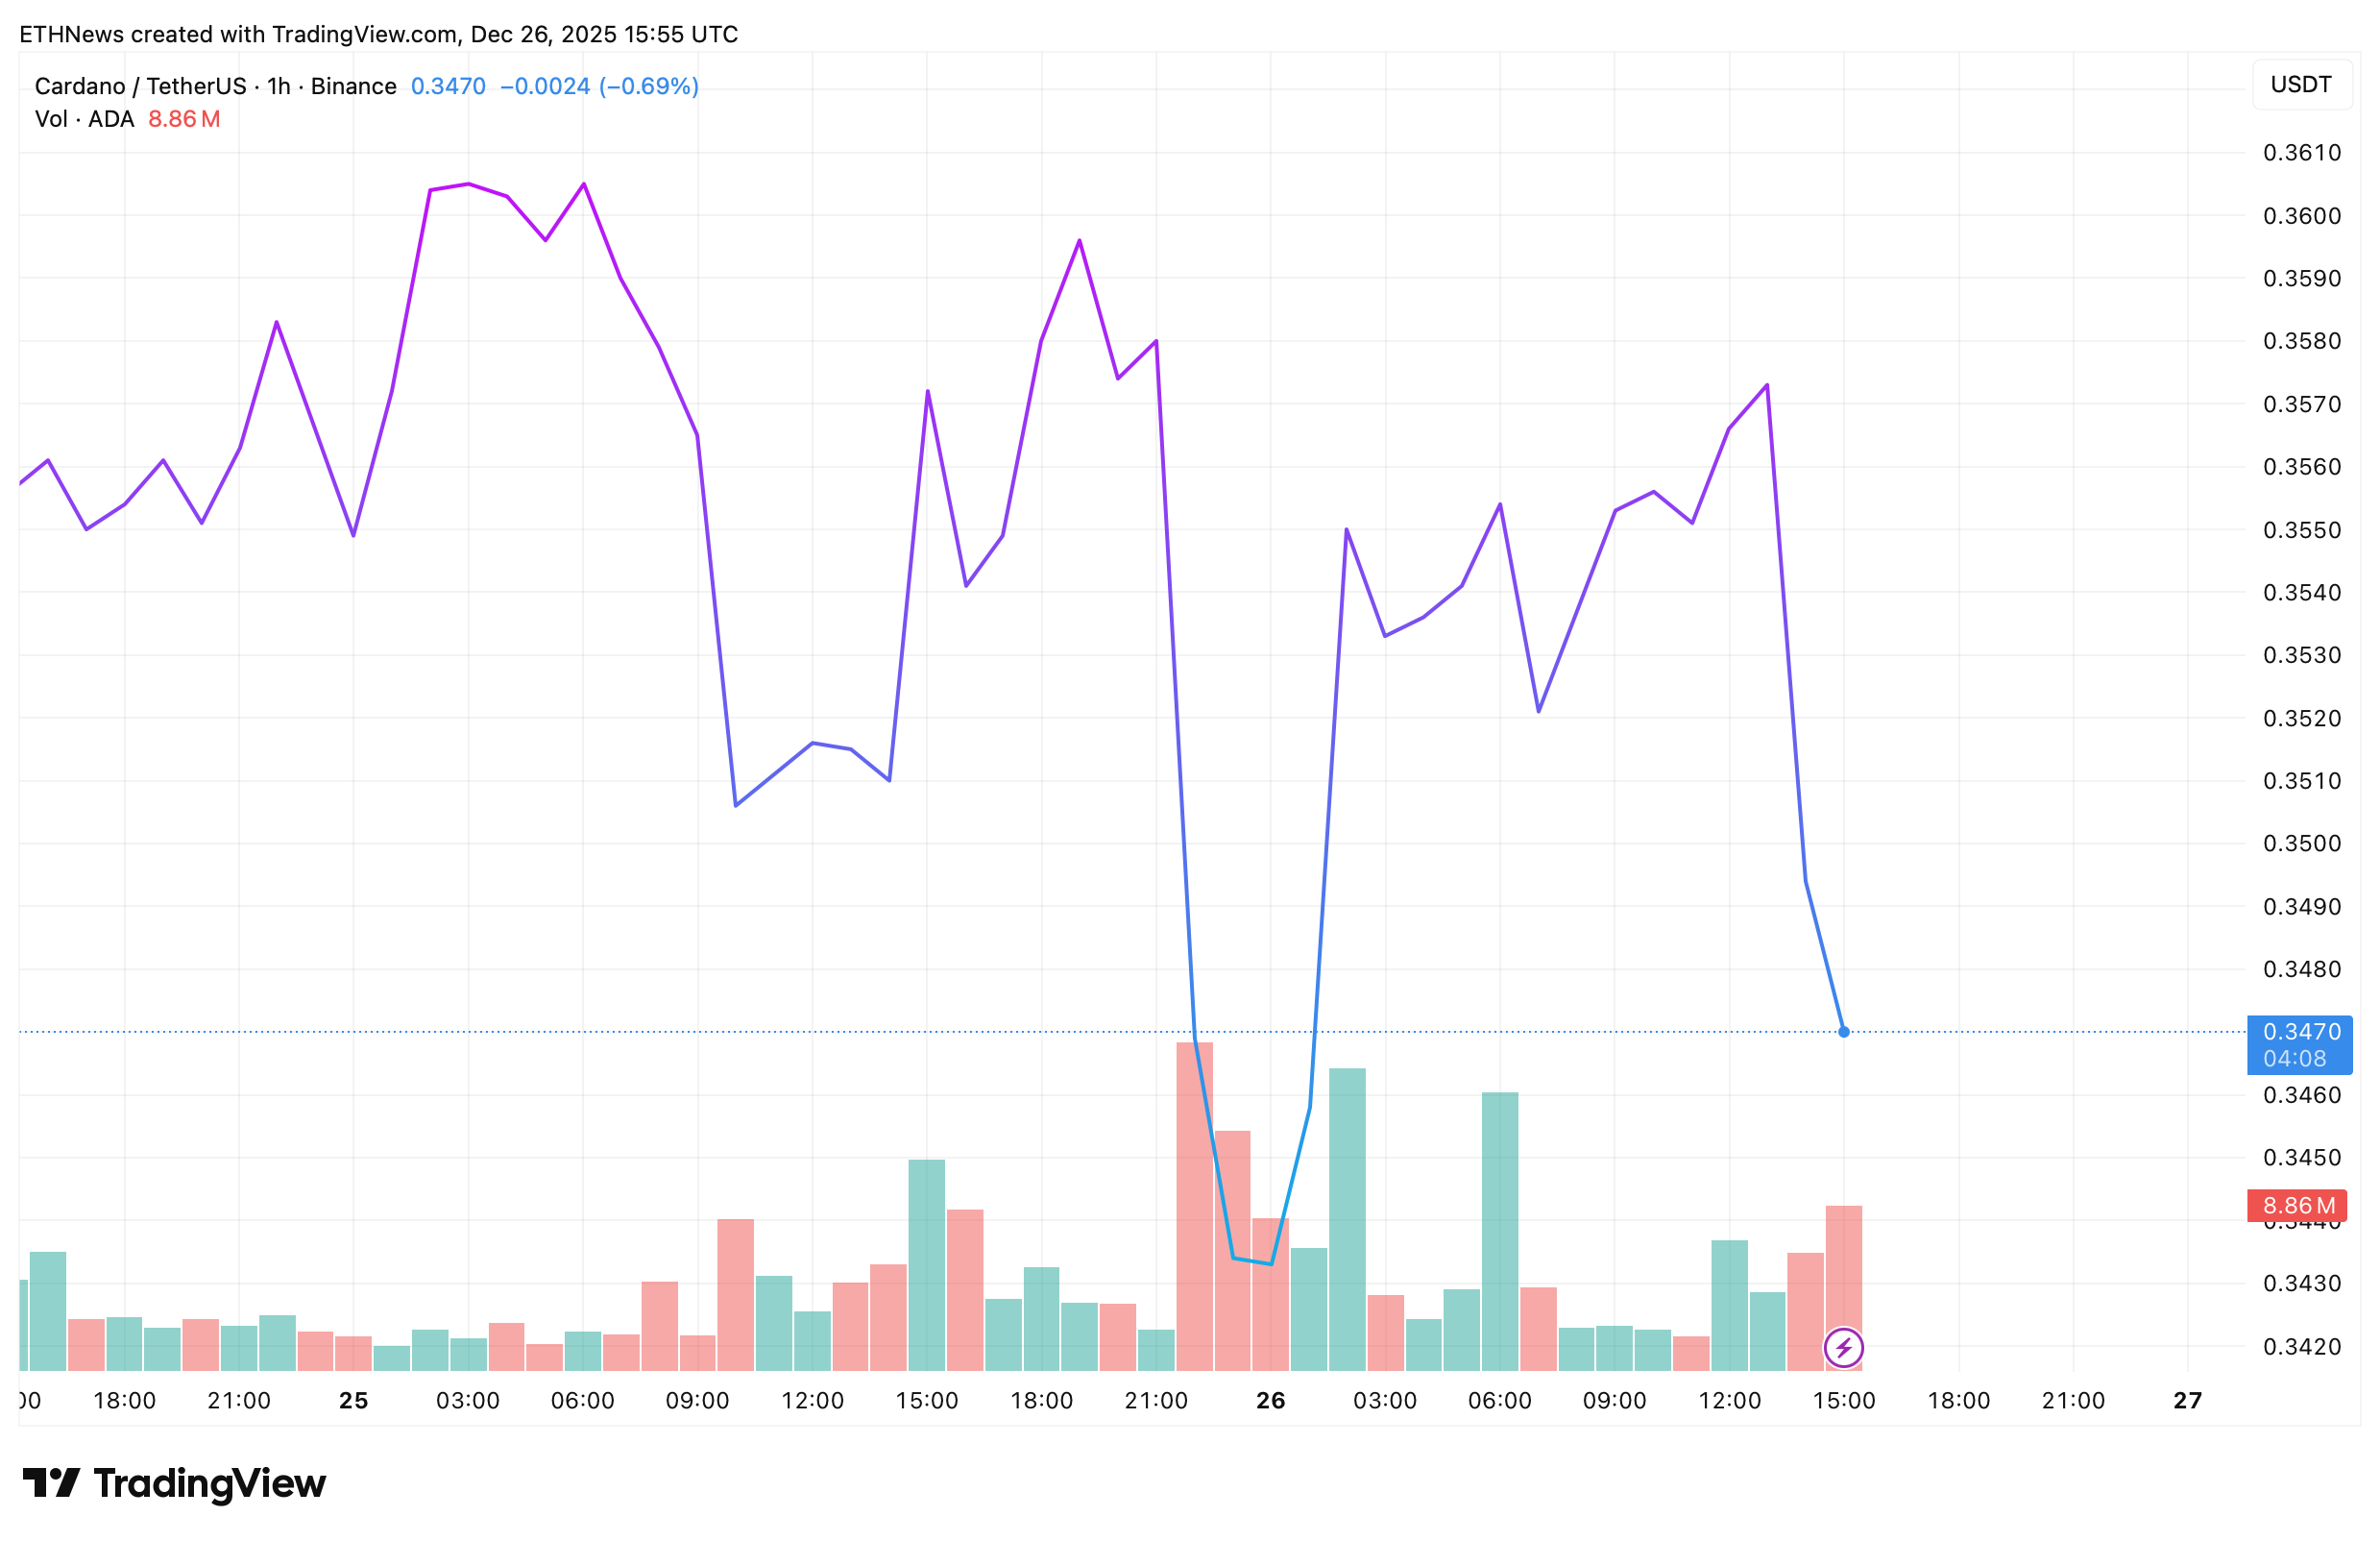
The rapid recovery, paired with elevated volume, indicates aggressive participation rather than slow distribution. However, ADA remains below earlier session highs, keeping short-term structure fragile.
Ali Martinez Highlights Bullish Engulfing Formation
Crypto analyst Ali Martinez noted that Cardano may be printing a bullish engulfing candlestick on the 12-hour chart. This pattern forms when a strong bullish candle completely overtakes the previous bearish candle, often signaling a potential momentum reversal.
Cardano $ADA may be printing a bullish engulfing candlestick. pic.twitter.com/9X6QmRhOCN
— Ali Charts (@alicharts) December 26, 2025
In the chart shared by Martinez, the latest 12-hour candle engulfs the prior red candle after a period of downside pressure. This positioning is important because bullish engulfing patterns tend to carry more weight when they appear after declines, suggesting seller exhaustion and renewed buying interest.
If the candle closes as shown, it would mark the first clear bullish structure on this timeframe since the recent pullback, shifting short-term sentiment from purely defensive to cautiously constructive.
Sentiment and Indicators Reflect Market Stress
Despite the emerging pattern, broader indicators still reflect a cautious environment. Sentiment remains bearish, with the Fear & Greed Index at 20 (Extreme Fear). Volatility is elevated at 7.42%, underscoring unstable conditions.
Momentum indicators remain neutral but stretched. The 14-day RSI near 33 signals weak momentum without confirming oversold conditions. Meanwhile, ADA continues to trade well below both the 50-day SMA ($0.445) and 200-day SMA ($0.686), reinforcing that the larger trend remains under pressure.
What the Setup Suggests Going Forward
The combination of a sharp intraday rebound, rising volume, and a potential bullish engulfing candle on the 12-hour timeframe suggests ADA may attempt a short-term relief move. However, confirmation is still needed through sustained buying and follow-through above recent resistance zones.
For now, Cardano appears to be transitioning from panic-driven selling toward a possible stabilization phase. Whether this develops into a broader recovery or remains a temporary bounce will depend on how price reacts in the next few candles.
At this stage, the charts show early preparation rather than confirmation, with Ali Martinez’s highlighted pattern serving as the key technical signal to watch.


