


Global liquidity is entering a new phase, and the shift is increasingly centered outside the United States. The chart highlights a striking reality: global narrow money (M1) has surged to roughly $45 trillion, with China accounting for the single largest share. According to the data, China’s adjusted M1 has climbed to about $16.5 trillion, representing around 37% of global narrow money, a level unmatched by any other economy.
By comparison, the U.S. M1, using a post-2020 adjusted measure that excludes savings deposits, stands near $8 trillion, or roughly 18% of the global total. The remainder is split across the G10 economies excluding the U.S., which collectively trail China’s expansion pace. This marks a structural change in where global liquidity is being created.
What the Chart Shows About Global Liquidity
The long-term view makes the divergence clear. For decades, global M1 growth was dominated by developed Western economies. Over the past fifteen years, however, China’s money supply has accelerated sharply, overtaking both the U.S. and the rest of the G10 combined. The steep rise into 2025 underscores how China has become the primary driver of global narrow money growth.
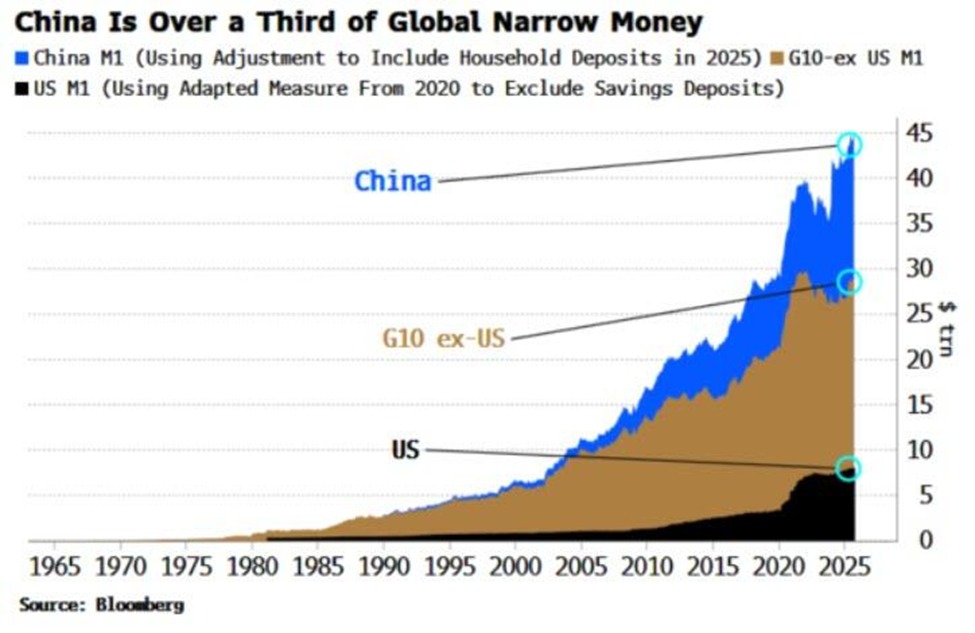
As noted by The Kobeissi Letter, global money supply is now at record levels, with China responsible for the majority of the increase this year. This expansion reflects aggressive domestic liquidity support, credit facilitation, and policy-driven stimulus aimed at sustaining growth amid structural economic pressures.
Why This Matters for Financial Markets
Expanding narrow money typically signals greater short-term liquidity in the system, which can influence asset prices even if economic growth remains uneven. When liquidity rises faster than productive output, capital often seeks outlets in financial assets, rather than real economic activity.
Historically, sustained increases in global M1 have coincided with:
- Higher asset valuations
- Increased speculative activity
- Stronger performance in liquidity-sensitive markets
The key takeaway from the chart is not just the size of global money supply, but where it is coming from. Liquidity generated outside the U.S. increasingly shapes global capital flows, especially in interconnected markets.
Implications for Crypto and Risk Assets
For crypto markets, global liquidity expansion is a critical backdrop. Bitcoin and other digital assets have consistently shown sensitivity to changes in global money supply, not just U.S. policy alone. As China and other non-U.S. economies inject liquidity, excess capital can still find its way into global risk assets through indirect channels.
While rising liquidity does not guarantee immediate price appreciation, it raises the probability of stronger medium-term demand for scarce, globally traded assets. In environments where fiat supply grows faster than confidence in long-term purchasing power, assets perceived as hard or supply-constrained often benefit.
At the same time, uneven liquidity distribution can increase volatility. Markets may experience bursts of risk-on behavior followed by sharp pullbacks as capital moves across regions and asset classes.
The Bigger Picture
The chart tells a simple but powerful story: global liquidity is expanding, and China now sits at the center of that expansion. This shift alters how investors should think about macro drivers, inflation risks, and cross-market correlations.
For crypto, equities, and commodities alike, the next cycle may be shaped less by a single central bank and more by global liquidity dynamics. As narrow money continues to grow, the question is no longer whether liquidity matters, but how markets will respond when so much of it is coming from outside the traditional Western core.


